Batavia, IL, USA apartments for sale
$459,000
$459,000
Available: Right Now
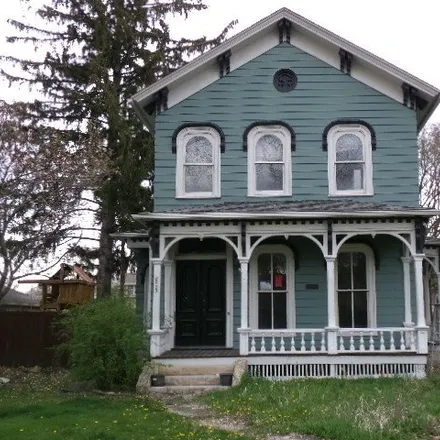
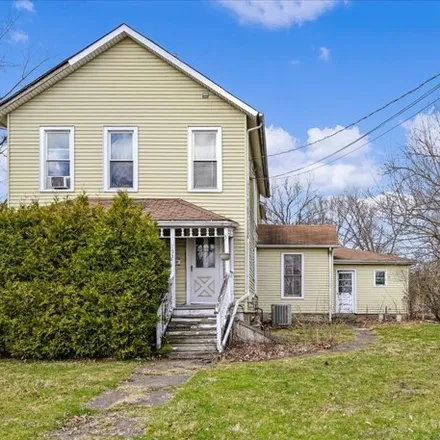
Attention Renovators/Contractors RARE Opportunity to purchase a home with seller financing , no money down but you must be a qualified renovator/contractor; otherwise traditional sale required. This historical home was originally owned and bui...
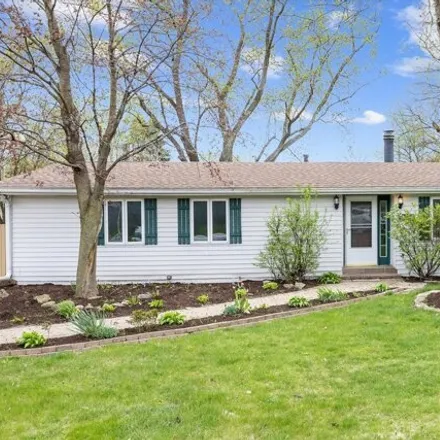
$429,900
$429,900
Available: Right Now
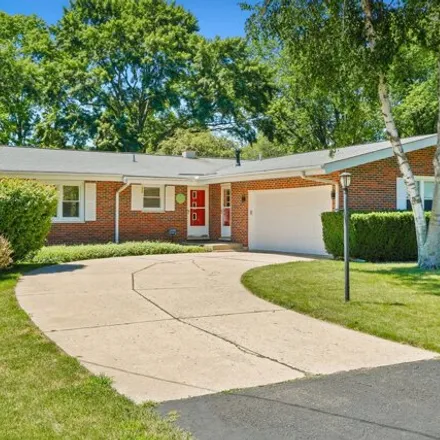
Welcome to this charming 4-bedroom, 2-bathroom ranch home, perfectly nestled in a quiet and friendly neighborhood. Step inside to discover the heart of the home: a stunning, newly remodeled white kitchen. Completed this spring, the kitchen features a...

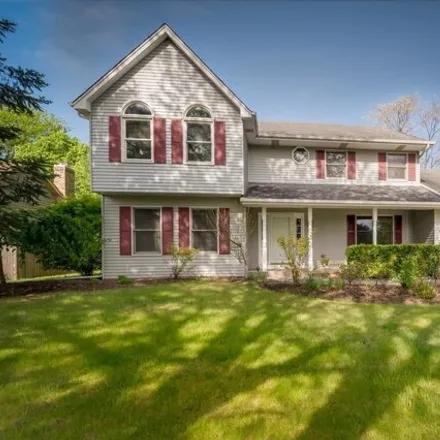
$440,000
$440,000
Available: Right Now
You will not want to miss this one ! The seller has poured much love and many upgrades into this home over the last few years, making it truly special. It's hard to leave as they have cherished every moment of living here. Great West Side Loca...

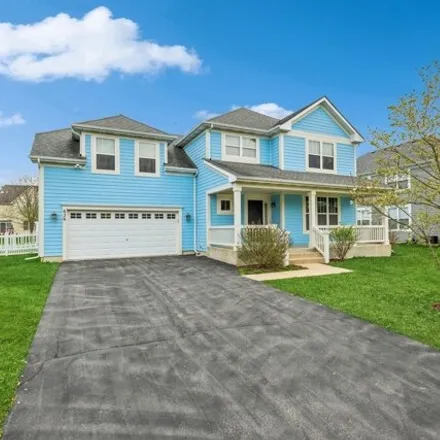
$575,000
$575,000
Available: Right Now
While away the hours beside your sparkling POOL, or entertaining on your expansive, flagstone deck -- all while enjoying views of the private, landscapedACREAGE.Outside and in, this handsome home has manyUPDATES,including a brand new air conditioner,...

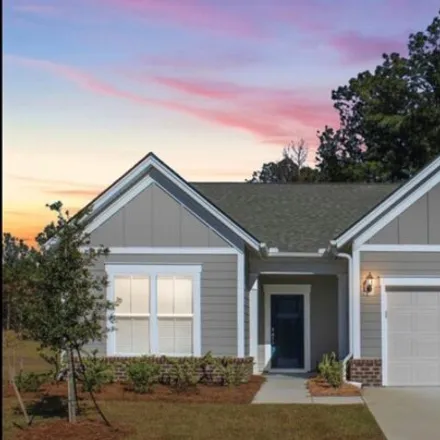
$389,990
$389,990
Available: Right Now
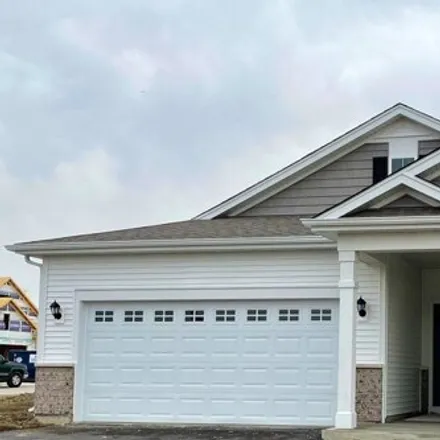
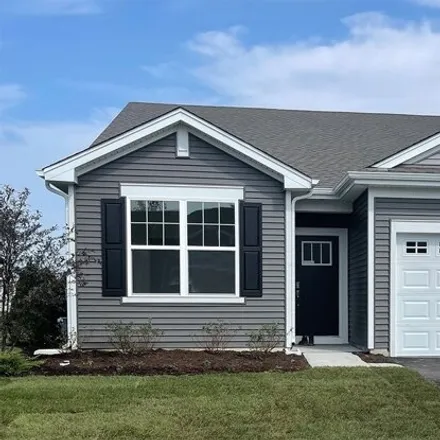
Brand new Shannon ranch duplex with a late Fall Delivery! The Shannon includes 2 bedrooms, 2 full baths, a den and a 2-car garage! Located in North Aurora, just minutes away from I88, shopping and amazing restaurants. The open-concept kitchen feature...
$549,990
$549,990
Available: Right Now
The beautiful Clifton ranch plan will be ready for a summer delivery! This home will feature a partial basement and is located on an amazing pond site. It is truly a GEM, boasting an open concept floor plan, with 2 bedrooms, a flex room, 2 full bathr...
$554,190
$554,190
Available: Right Now
Beautiful new construction homes in an ideal location within the Batavia School district. Just two miles from shopping, dining and entertainment along the Randall Rd corridor plus downtown Batavia. Winding Creek offers ranch and two-story homes . ...

$369,900
$369,900
Available: Right Now
Welcome to228 N.Washington, a charming Mediterranean 1.5-story home thoughtfully converted into a legal two-unit building. This property features a two-car garage and additional off-street parking for three cars, ensuring ample space for residents an...
$515,000
$515,000
Available: Right Now
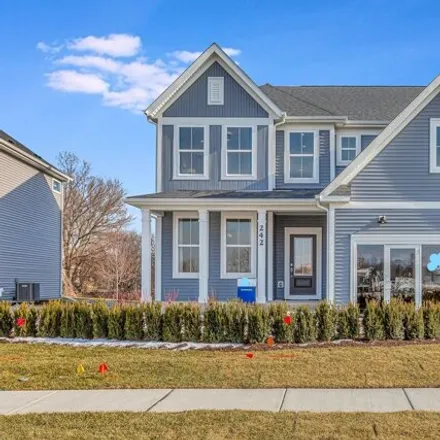
Don't miss this stunning 4-bed, 3-full bath home in Windemere with over 3600 sq ft! It boasts an open floor plan, first-floor den, elegant living and dining rooms, and a kitchen with cherry cabinets. Upstairs, find a spacious master suite and a large...
$349,900
$349,900
Available: Right Now
Welcome to this beautiful ranch style home! The property has 3 bedrooms, 1.1 baths, 2 car garages with a brick driveway with plenty of extra parking for this family/friend gatherings. In the summer you can enjoy your inclosed 23X12 four season room, ...

$350,000
$350,000
Available: Right Now
Why wait! This home is ready today-be swimming the day you close! Enjoy all the amenities of Lincoln Valley. The Clara offers 2 bedrooms PLUS a private office. 2 full bathrooms, and a 2-car garage. Everyone loves a big kitchen Island, and this unit p...
$499,890
$499,890
Available: Right Now
Beautiful new construction homes in an ideal location within the Batavia School district. Just two miles from shopping, dining and entertainment along the Randall Rd corridor plus downtown Batavia. Winding Creek offers ranch and two-story family home...
$499,900
$499,900
Available: Right Now
Fantastic house ideally located close to everything. Formal dining and living room, separated by grand foyer that greets you as you enter the home. Living room as well as foyer lead to a large family room with a wood burning fireplace. The kitchen is...

$419,000
$419,000
Available: Right Now
Charming river-view brick cottage is ready for new owners! The exquisite yard offers serenity and space to explore. Walk down to the Fox River from the yard, or jump on the bike path to downtown Batavia. This lot is nestled among Merlo quarry, giving...
$325,000
$325,000
Available: Right Now
Excellent investment property opportunity! Location can't be beat! This 2 flat has an attached oversized 2.5 car garage, 2 porches, and sits on a corner lot. High ceilings, wood floors, and lots of original character throughout. 1st floor unit has 3 ...

$350,000
$350,000
Available: Right Now
Look at the great curb appeal of this 3 bedroom, 2 bath, 2 car garage home with a 1st floor master all on a charming tree-lined street close to downtown Batavia. Welcoming front porch! Updated kitchen has island with breakfast bar, granite cou...

$509,990
$509,990
Available: Right Now
Introducing the Dover ranch plan, available for Fall delivery at Lincoln Valley in North Aurora! Walking into this home you will be greeted with an open and airy floor plan boasting 9ft ceilings! 3 bedrooms, 2 full bathrooms plus a flex room offer am...

$509,990
$509,990
Available: Right Now
Brand-new Single-Family Ranch Home in Lincoln Valley, with a late summer delivery! The beautiful Clifton ranch plan offers low maintenance with lawn care and snow removal included. This home boasts an open concept floor plan, with 2 bedrooms, a flex ...
$393,990
$393,990
Available: Right Now
You must see the Shannon floorplan today!! Our popular duplex backs up to a beautiful pond with no rear neighbors; you are sure to love your new view. The Shannon has lots of two's including 2 bedrooms, 2 full bathrooms, and a 2-car garage! Located i...

$399,900
$399,900
Available: Right Now
Buyer got cold feet - no inspection conducted Over2, 300sf of space in this beautifully maintained and move in ready home! Gorgeous and bright open floor plan includes a Kitchen with eating space plus breakfast bar area. Modern finishes includ...

$290,000
$290,000
Available: Right Now
Location, Location! Rarely Available Ground Level Ranch Townhome with Vaulted Ceilings in Georgetown! Glass doors from Living Room and Primary Bedroom lead to Private Patios. En-suite bath with Large Soaker Tub, Dual Vanities and Walk in Closet. Atta...
$359,900
$359,900
Available: Right Now
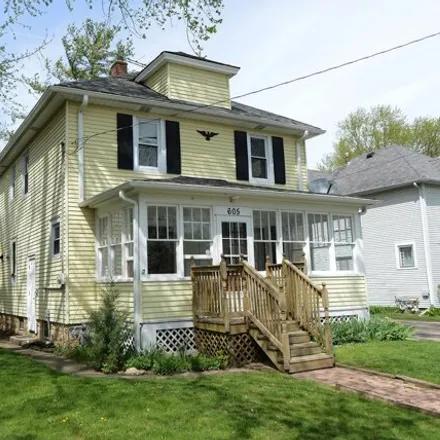
Lovely home in Great Location in-town Batavia- close to schools, parks, shopping, restaurants and All that Downtown Batavia has to offer- Riverwalk, Bike and Walking trails, Farmers Market, Hall Quarry Park and abundant fabulous Park District Activit...
Batavia
According to statistics, the population in Batavia, IL amounts to 26,499, which shows decline 0% compared to the previous year. The median age of the city’s residents is 42. The average household income is $92,094, shifting growth 2% from the past year, and the average property value in Batavia, IL growth 4% to $290,200 throughout the year.
| Population | 26,499 |
| Median Age | 41.9 |
| Poverty Rate | 6% |
| Household Income | $92,094 |
| Number Of Employees | 13,615 |
| Median Property Value | $290,200 |
Household Income
The average household income in Batavia, IL grew from $89,932 to $92,094 in the past year. This data is an estimate based upon 9,940 households in Batavia, IL . The chart below presents how household income is distributed in Batavia, IL in comparison to the revenue allocation amid households nationally.
Property Value
According to data from last year, the average property value in Batavia, IL shifted from $278,600 to $290,200 throughout the year. The subsequent graph indicates the share of properties in the given price range in Batavia, IL in comparison to the median property value in the same price segment across the country. According to the data, the greatest share of Batavia, IL properties falls in the '$300,000 to $399,999' range, which is higher than the most significant median property across the country.
Rent vs. Own
Property Taxes
One of the most important aspects for property owners is the amount of property taxes. This graph shows distribution of property taxes in Batavia, IL compared to median property taxes around the country. The prevalent amount of property taxes in Batavia, IL equals $3000, which is less than the national average.