Baytown, TX, USA apartments for sale
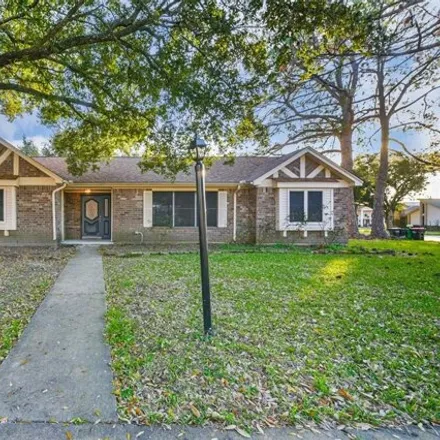
$294,500
$294,500
Available: Right Now
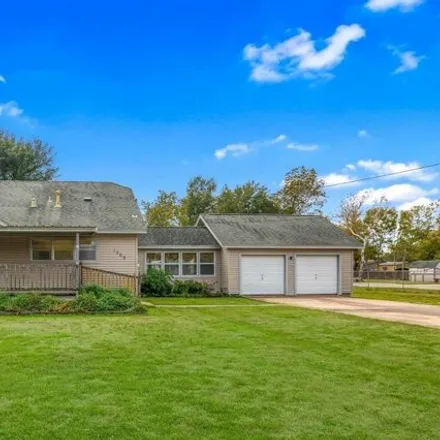
Come give this cozy one story a look and you will fall in love! This 3 bedroom 2 bathroom single story house is sure to impress. With a stunning living area with intricate accent walls and large open space to spend with family including a comfy firep...
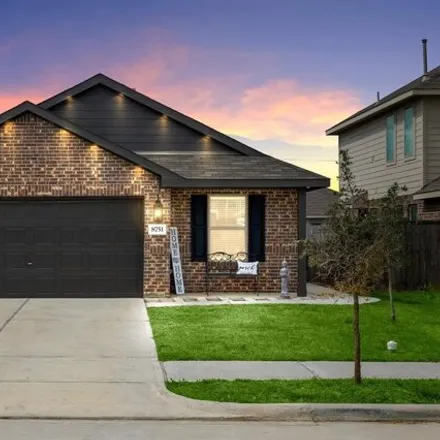
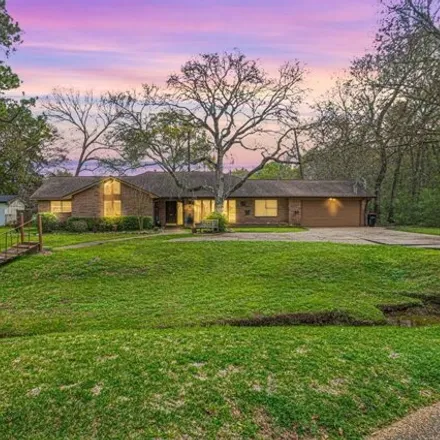
$210,000
$210,000
Available: Right Now
Grand opening ! Open house saturday march 16th and Sunday march 17th From 12:00pm-4:00pm ! Welcome to your dream home at 8751 Bar Harbor Drive, nestled in the Wooster Crossing community and zoned to Goose Creek Consolidate...
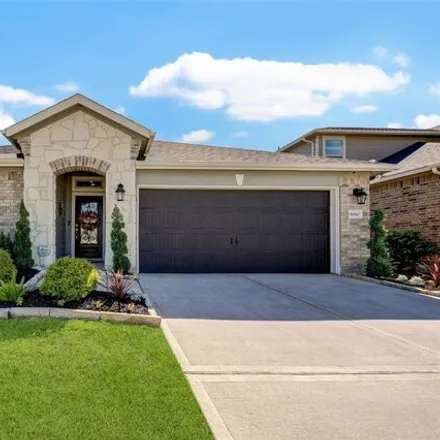
$285,000
$285,000
Available: Right Now
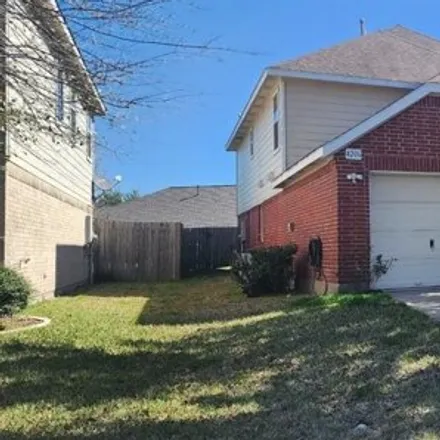
Welcome to the absolutely stunning 9010 Blue Star Lane! Upon arrival, you are greeted by beautiful curb appeal accompanied with well-kept landscaping. As soon as you walk in the home, you'll feel as if you're walking into a model home! This home feat...
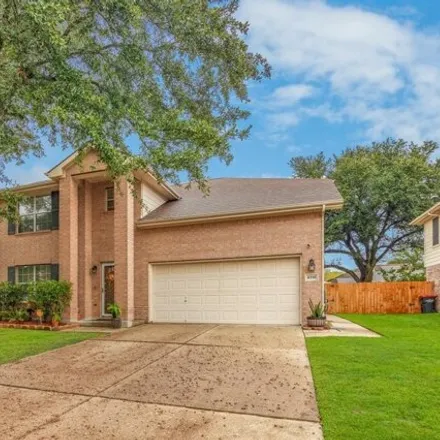
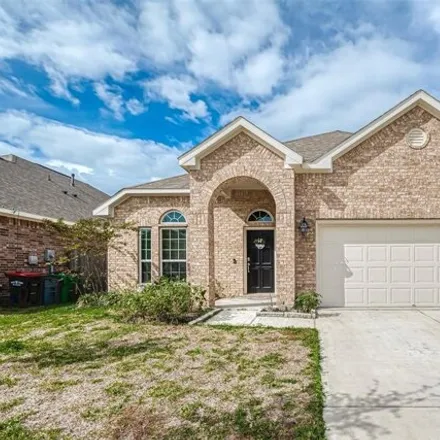
$289,900
$289,900
Available: Right Now
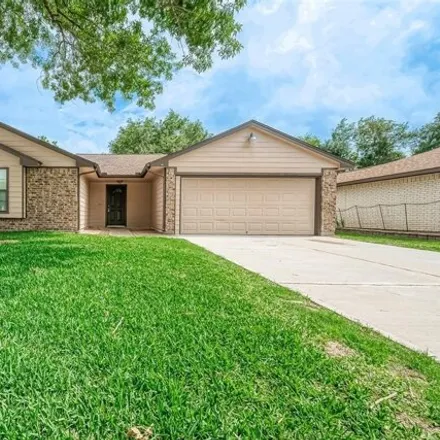
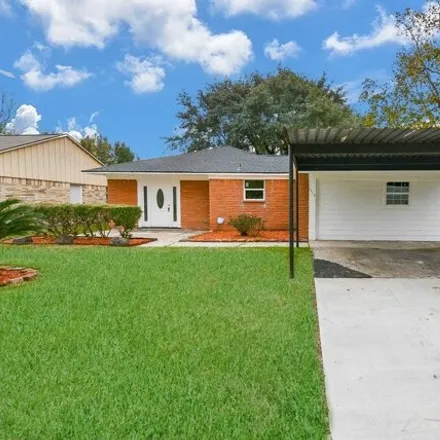
This beautiful 3 bedroom, 2.5 bathroom, large study, 2 car garage home offers a spacious and inviting living space. The spacious kitchen has been updated with granite countertops and stainless steel appliances. Tile flooring throughout the home. Ceil...
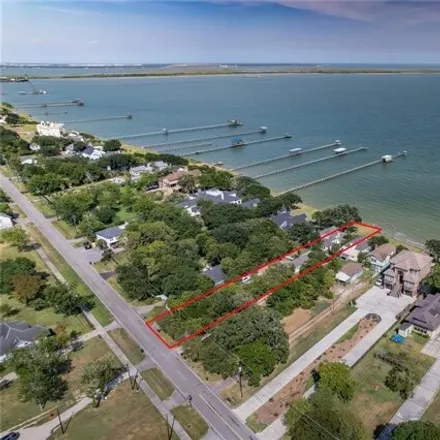
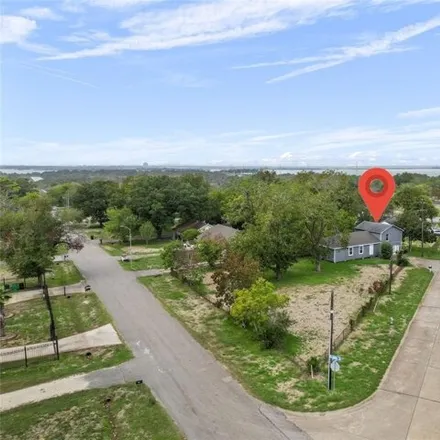
$625,000
$625,000
Available: Right Now
Historic bayfront home in popular morgans point - perfect for a primary home, weekend getaway or short-term rental w/ a short commute to houston ! Built in 1905, the home is listed on the historical registry and Features a carriage h...
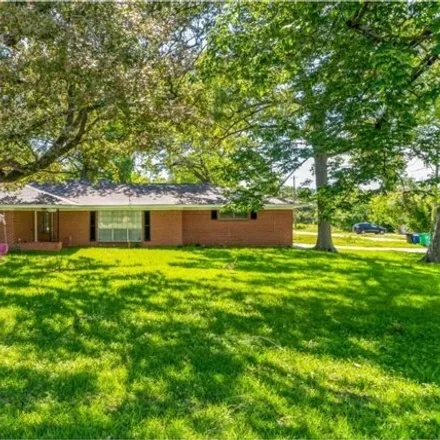
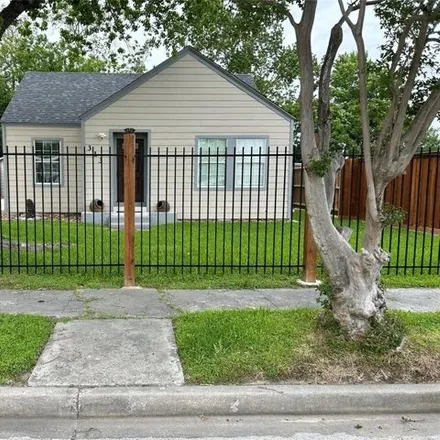
$245,000
$245,000
Available: Right Now
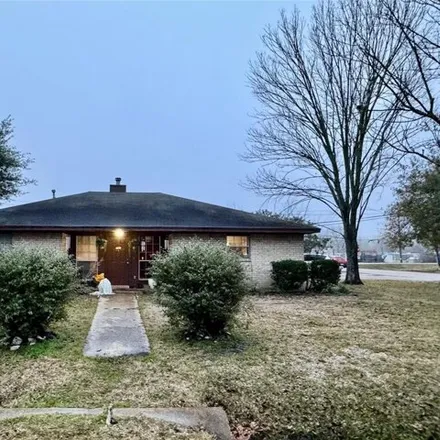
We're pleased to present the opportunity to acquire a Rare gem property in a highly demanded Baytown, TX 77520.Including 3 bedrooms and 2 bathrooms, you are going to enjoy the1, 853sqft that composes this House built in 1957. Nested in an enjoyable n...
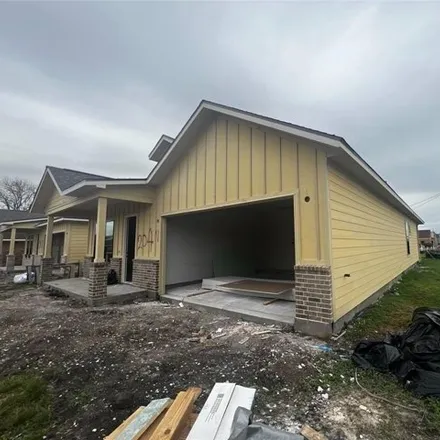
$325,000
$325,000
Available: Right Now
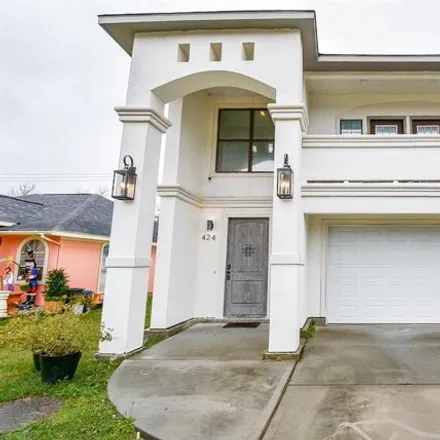
Welcome to your move-in ready haven at 204 N 3rd St. This newly completed construction offers the perfect blend of modern comfort and timeless appeal. Step into a thoughtfully designed space featuring an open floor plan and high-end finishes througho...
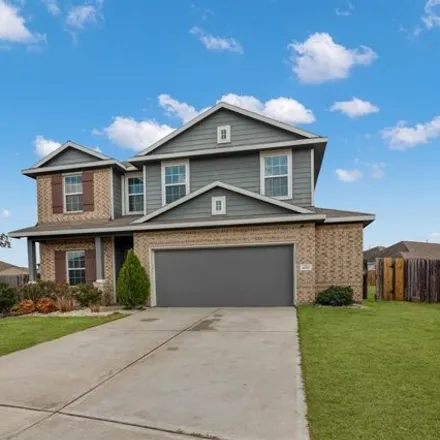
$319,900
$319,900
Available: Right Now
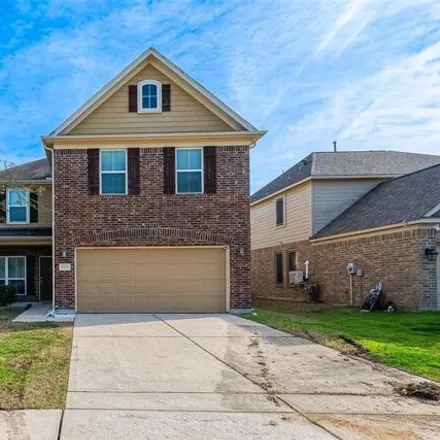
Welcome to this amazing 2 Story 2516 sq. ft home sitting on an oversized Cul-de-sac lot. The open floorplan offers high ceilings with a beautiful kitchen that opens into the large family room. This home includes 4 bedrooms, a study, 2 full and 1 half...
$299,000
$299,000
Available: Right Now
WOW! This is an incredible opportunity to own a beautiful property at an unbeatable price. While a few touch ups are needed, the asking price reflects this, providing you with the perfect chance to shape this space into your dream home. Currently con...
$268,000
$268,000
Available: Right Now
Perfect home for a multi-generational family - 2 primary bedrooms plus another spacious 3rd bedroom with a walk-in closet - (total of 3 full bathrooms) - seller has been hard at work updating paint, carpet, and even a new on-demand water heater for o...
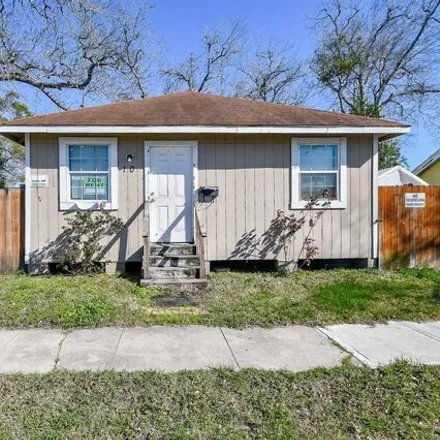
$165,000
$165,000
Available: Right Now
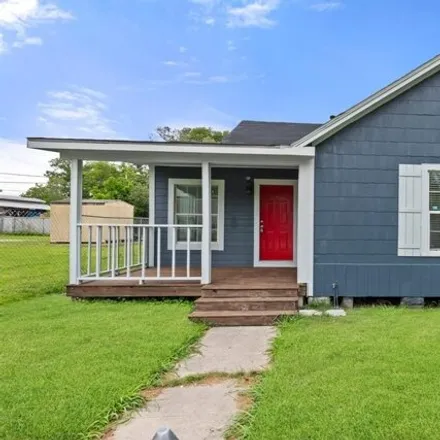
Step into your new sanctuary! This delightful 3 bed, 1 bath home beckons with its charming curb appeal and inviting front porch, perfect for enjoying your morning coffee or unwinding after a long day. Inside, you'll discover a recently renovated inte...
$239,000
$239,000
Available: Right Now
This home sits on a corner lot. It is a nice home with 3 bedrooms with a potential 4th bedroom/Study, 2 baths, 3 car oversized garage. The home is brick, pool in the back yard, high ceilings in the Den. Kitchen open to den with lots of custom cabinet...
$225,000
$225,000
Available: Right Now
Built in 1925, this spacious home has stood the test of time! It features 2 bedrooms and a full bath upstairs and 2 bedrooms and a full bath downstairs. The large island kitchen offers a huge pantry/utility room. The living room and sun room provide ...
$350,000
$350,000
Available: Right Now
Welcome to your dream home! This stunning 2-story home boasts 4 bedrooms, 3.5 bathrooms, and a large gameroom. Step inside to discover a generously sized family room perfect for gatherings and relaxation. The spacious kitchen is a chef's delight, off...
$220,000
$220,000
Available: Right Now
Welcome to this charming 4-bedroom, 2.5-bathroom residence spanning1, 584square feet. Nestled in a peaceful neighborhood, this home boasts a convenient 2-car carport and a meticulously designed interior. The open-concept living area seamlessly connec...
$319,786
$319,786
Available: Right Now
This beautiful home welcomes you! As you walk up you find a covered porch to have your morning coffee at or sit at in the afternoons and watch the sunset. Once you enter you find yourself with an inviting tiled dining room. The kitchen has beautiful ...
$315,000
$315,000
Available: Right Now
Own a piece of Baytown! This charming duplex at 99 Brownwood Drive offers the perfect opportunity for homeownership and potential rental income. Features: Two spacious units, ideal for owner-occupancy with rental income or investment property. Each u...
$225,000
$225,000
Available: Right Now
Cute and Cozy 3 bedroom, 2 bath updated home ready for new owners vinyl plank flooring in living, dining and hall - ceramic tile flooring in kitchen and baths - carpet in bedrooms front door opens into view of living room and dining room with deep ba...
$225,000
$225,000
Available: Right Now
Step into the realm of possibility with this remarkable property boasting not one, but two homes ripe for renovations. Envision the potential for lucrative income streams as you explore the endless opportunities these residences present. Discover the...
$300,000
$300,000
Available: Right Now
Discover the epitome of single-story living in this charming 4-bed, 2-bath home with an inviting open-concept floor plan. Nestled in a charming neighborhood, you'll have the added convenience of a water splashpad and playground just a short stroll aw...
$340,000
$340,000
Available: Right Now
Beautiful 4 bedroom 2 bathroom home on 0.4 acres with a large yard, private bridge in the front yard. Open and spacious kitchen over looking a beautiful custom patio perfect for entertaining. Each bedroom has its very own large walk in closet. Comfor...
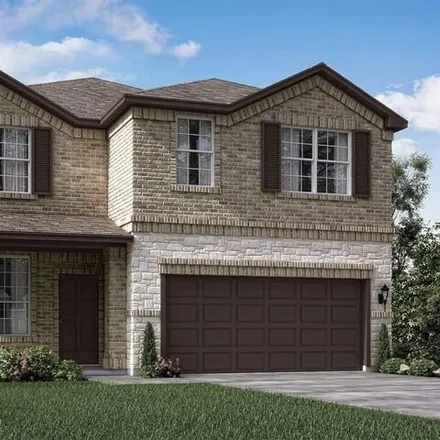
$428,280
$428,280
Available: Right Now
Brand NEW energy-efficient home ready June 2023! Two story with more to adore. A formal dining room flows to the vast kitchen, casual meal spot and family oasis. Upstairs bed, game and media rooms hide from the tranquil downstairs primary suite. Over...
Baytown
According to statistics, the population in Baytown, TX amounts to 76,205, which shows growth 1% compared to the previous year. The median age of the city’s residents is 33. The average household income is $51,874, shifting growth 4% from the past year, and the average property value in Baytown, TX growth 7% to $103,300 throughout the year.
| Population | 76,205 |
| Median Age | 32.7 |
| Poverty Rate | 17% |
| Household Income | $51,874 |
| Number Of Employees | 32,799 |
| Median Property Value | $103,300 |
What is the Average Price of Apartments for Sale in Baytown, TX?
| Month | Median Price |
|---|---|
| Apr 2024 |
$293,972
|
| Mar 2024 |
$293,972
|
| Feb 2024 |
$293,972
|
| Jan 2024 |
$293,972
|
| Dec 2023 |
$252,130
|
| Nov 2023 |
$280,221
|
| Month | Median Price |
|---|---|
| Apr 2024 |
$303,275
|
| Mar 2024 |
$303,275
|
| Feb 2024 |
$303,275
|
| Jan 2024 |
$303,275
|
| Dec 2023 |
$262,493
|
| Nov 2023 |
$310,848
|
Household Income
The average household income in Baytown, TX grew from $49,930 to $51,874 in the past year. This data is an estimate based upon 26,227 households in Baytown, TX . The chart below presents how household income is distributed in Baytown, TX in comparison to the revenue allocation amid households nationally.
Property Value
According to data from last year, the average property value in Baytown, TX shifted from $96,100 to $103,300 throughout the year. The subsequent graph indicates the share of properties in the given price range in Baytown, TX in comparison to the median property value in the same price segment across the country. According to the data, the greatest share of Baytown, TX properties falls in the '$100,000 to $124,999' range, which is lower than the most significant median property across the country.
Rent vs. Own
Property Taxes
One of the most important aspects for property owners is the amount of property taxes. This graph shows distribution of property taxes in Baytown, TX compared to median property taxes around the country. The prevalent amount of property taxes in Baytown, TX equals $3000, which is less than the national average.