Bell, CA, USA apartments for sale
$950,000
$950,000
Available: Right Now
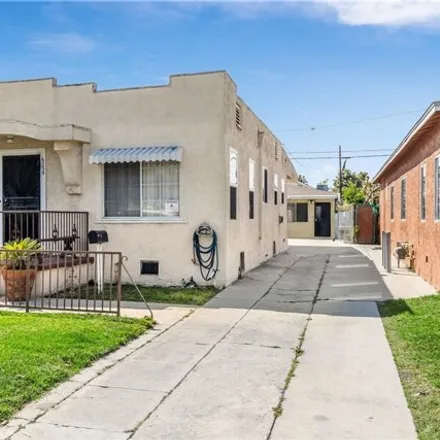
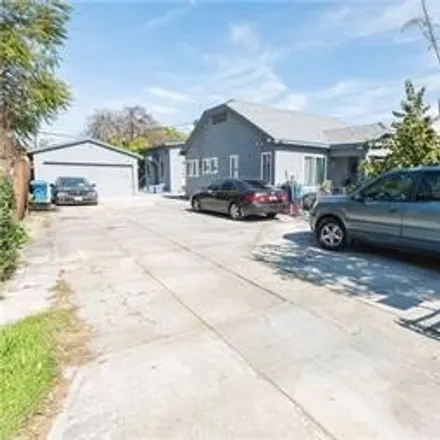
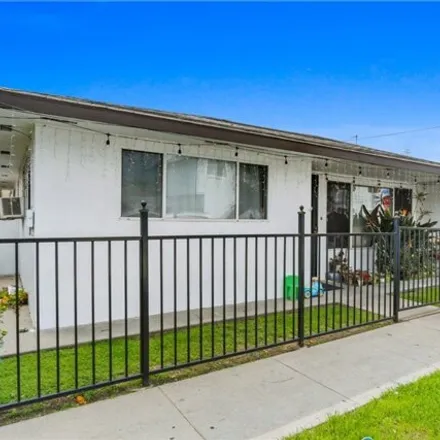
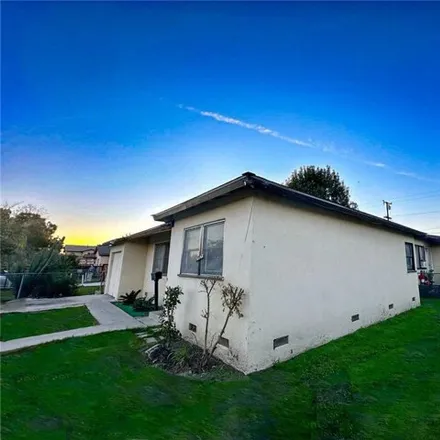
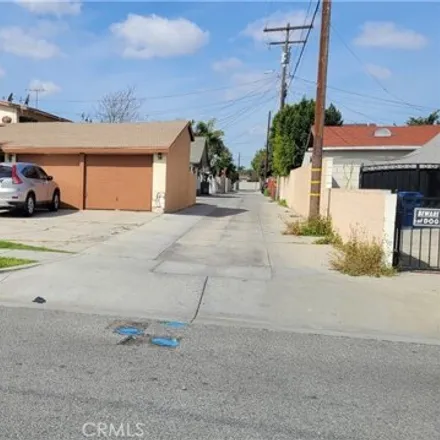
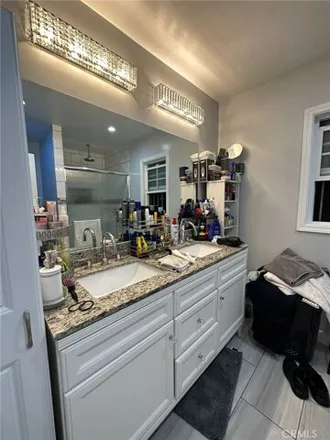
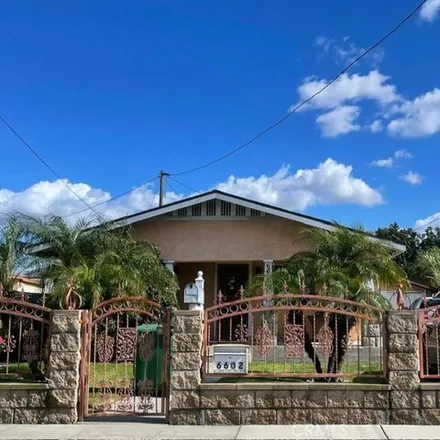
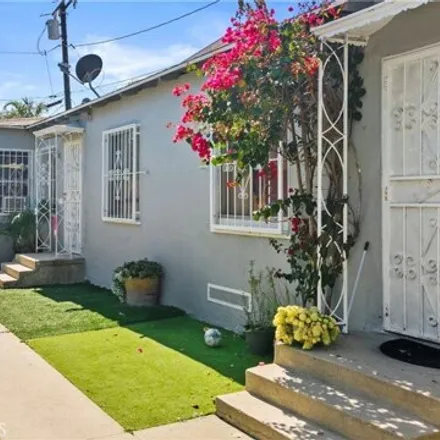
6235 Walker Ave is an exceptional owner-user duplex with two detached homes. Currently owner-occupied. The property sits on a6, 026sq. ft. lot, which features a spacious1, 526sq. ft. 3-bedroom, 2-bathroom front house and a large 850 sq. ft. 2-bedroom...
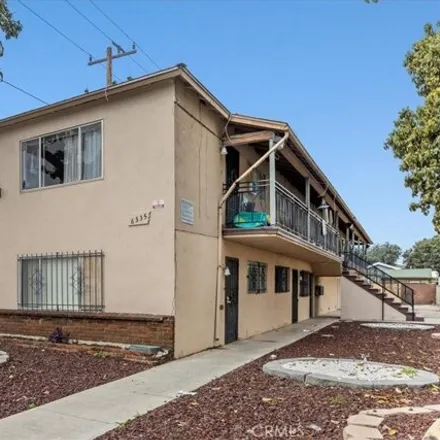
$675,000
$675,000
Available: Right Now
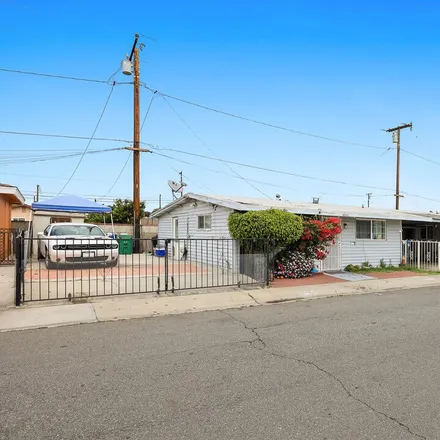
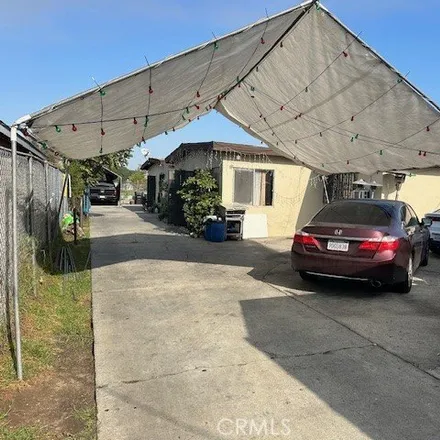
Calling all investors !!!!!! In the Heart of Bell!!!! Incredible opportunity to own a possible rental income property, Single Story Duplex Features Unit 1: 1 bedroom/ 1 bath and Unit 2: 1 Bedroom/1 Bath. Ample parking, Desirable area!! ...
$1,8M
$1,8M
Available: Right Now
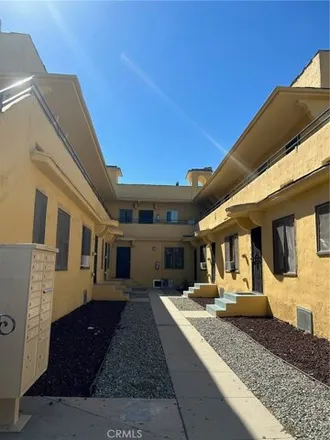
Unique Investment Opportunity in Cudahy. Overview: Here's your chance to own 5 units in the energetic city of Cudahy. This unique investment opportunity is perfect for investors looking to start or expand their portfolio. The property, built in 1988,...
$1,71M
$1,71M
Available: Right Now
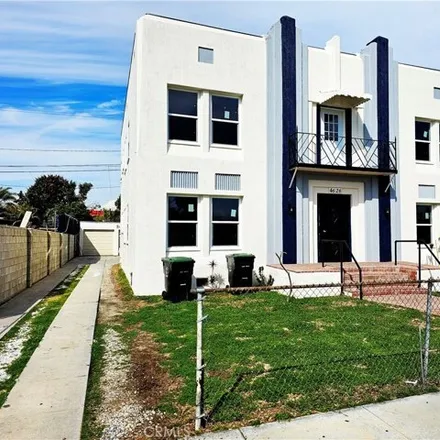
Great investment opportunity for anyone ready, willing and able. This fourplex has the beauty of becoming a producing income property or to be occupied by a numerous family. Multifamily residencia units, front unit features 3 bedroom 2 bathrooms with...
$999,000
$999,000
Available: Right Now
3 separate units on a lot size over 9000 square feet. This property features a large owners unit of 2 bedrooms, plus two 1 bedroom units, live in one and rent the others. 2 garages, one basic two car garage and a large extended two car garage. Perfec...
$700,000
$700,000
Available: Right Now
$3,3M
$3,3M
Available: Right Now
Reduction ! Great income property in city of Maywood ideal for investors. It is under professional management for years with majority long time/stable tenancies. All 14 units are fully occupied. All tenants are current on rent, next annual ren...
$1,3M
$1,3M
Available: Right Now
Newly Remodeled Multi-Family Residence in Maywood! Fully occupied. Discover this investment gem featuring four units, each with 2 bedrooms and 1 bath. Fully updated, each apartment boasts new kitchen cabinets and modern appliances, offering a fresh a...
$535,000
$535,000
Available: Right Now
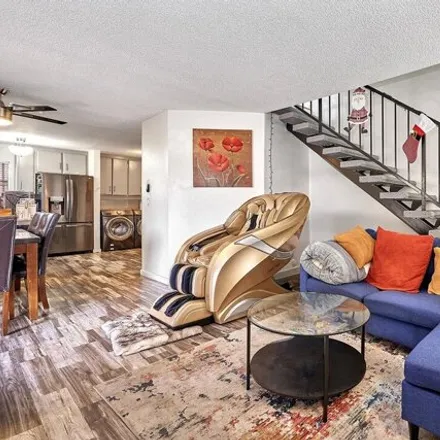
Welcome to your new home! This beautiful townhouse offers 3 spacious bedrooms, 2 baths, and a detached 2-car garage in a quiet neighborhood. Inside, enjoy new laminate floors, fresh fans, updated kitchen countertops, blinds, and paint. The roof is br...
$945,000
$945,000
Available: Right Now
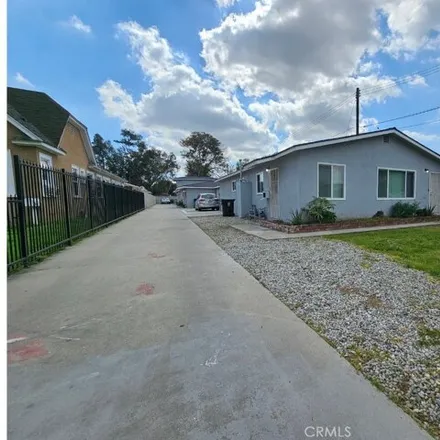
945k or TRADE Great income property with lots of potential. Lot over8, 700square feet. 3 Separate units all with attached garages Plus each unit has room for additional parking.. 2 of the units are used as 3 bedroom units with 1 bathroom and the 3rd....
$1,03M
$1,03M
Available: Right Now
Great investment opportunity in the City of Maywood. This Triplex property has the front house with 2 bedrooms, 1 bathroom, 2 car garage with additional storage room and a long driveway for more vehicles. The second unit behind the front house has 1 ...
$949,888
$949,888
Available: Right Now
Amazing opportunity to own an investment property located in a desirable pocket of Bell, CA! This charming duplex has undergone a complete top-to-bottom renovation including new mini splits in each unit, new windows, new floors, new kitchen cabinets,...
$949,000
$949,000
Available: Right Now
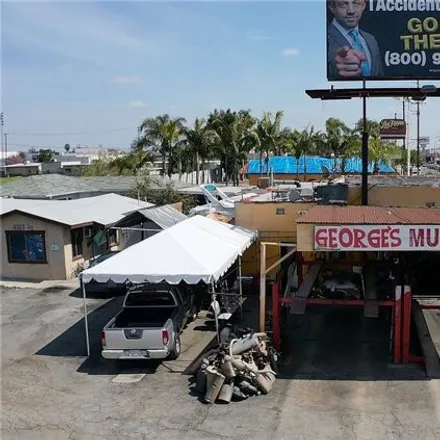
Welcom to this Unique Commercial and Residential Mixed Use Income property for an investor who can collect 2 rental income or for a Business owner who can live at their own home and run a business at a steps away commercial building. Residential Unit...
$988,000
$988,000
Available: Right Now
Triplex in the City Of Bell Gardens Portfolio sale. The properties are each 2bed 1 bath with plenty of yard space and no shared walls. Front unit is vacant and can be occupied by the owner or a new tenant. Property qualifies for the new 5% down payme...
$1,35M
$1,35M
Available: Right Now
Very workable and convenient for investor or occupant. This property consists of a room two bedroom house in front, another two bedroom house in the rear and in between a two story fourplex containing four - 1 bedroom units with parking in front ....

$739,000
$739,000
Available: Right Now
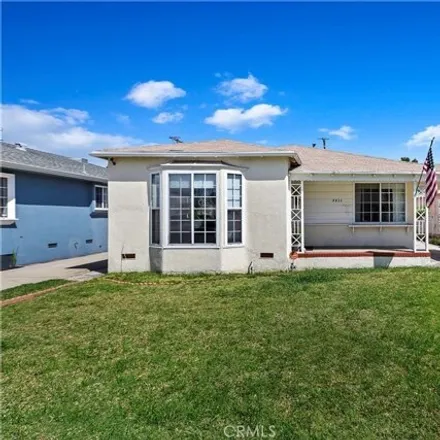
Perfect opportunity to own a beautiful single family home on a quiet street in Bell. This 3 bedroom and 2 full bath home is well maintained and ready to move in. The open floor plan connects the kitchen, dining and the large living room at the rear o...
$850,000
$850,000
Available: Right Now
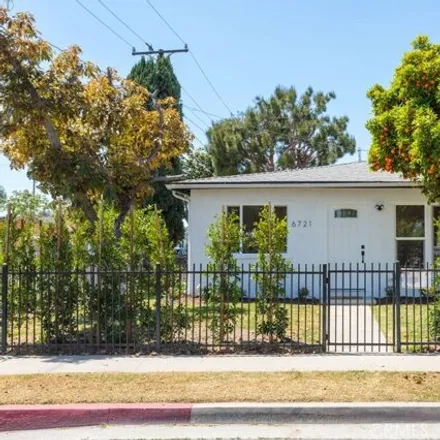
Beautiful home update Pluming, roof, Hardware Floor, the bathroom complete exquisite remodeled, update kitchen with nice Granite Backsplash, beautiful island, new driveway, modern water heater controled by Google nest , smart lockbox Fence installed ...
$750,000
$750,000
Available: Right Now
Calling all investors ! This is an amazing opportunity to own a home in the LA region with mortgage assistance from additional units OR own an investment property! This is a large beautiful duplex with a converted garage; 3/1, 2/1, 1/1.there a...
$865,900
$865,900
Available: Right Now
Discover an exceptional investment opportunity in the heart of Maywood! This rare-to-find 4-unit property features each 1 bedroom and 1 bath, providing steady income and great potential for appreciation. The property includes a 3-car garage and addit...
$614,888
$614,888
Available: Right Now
Welcome to the beautiful City of Huntington Park. The Home Features 2 bedrooms 1 bathroom. Home features a detached garage converted to an unpermitted studio and has a long driveway for plenty of parking. Home is centrally located to shopping centers...
$669,000
$669,000
Available: Right Now
Welcome to 5800 Priory, a charming abode that exudes comfort and style. As you approach, the double gated driveway immediately catches your eye, offering ample parking and a delightful surprisea secondary gate for additional vehicles. Stepping throug...
$1,9M
$1,9M
Available: Right Now
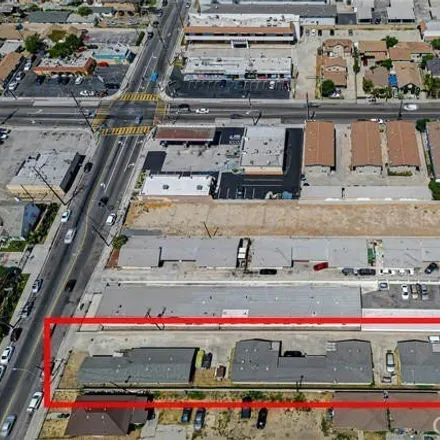
Presenting a distinguished investment opportunity, this income property, comprising 7 units, is strategically positioned in the City of Bell. Offering an attractive price point and a commendable income yield, this multifamily asset is an optimal choi...
Bell
According to statistics, the population in Bell, CA amounts to 35,942, which shows decline 0% compared to the previous year. The median age of the city’s residents is 30. The average household income is $39,686, shifting growth 2% from the past year, and the average property value in Bell, CA growth 9% to $352,000 throughout the year.
| Population | 35,942 |
| Median Age | 30 |
| Poverty Rate | 25% |
| Household Income | $39,686 |
| Number Of Employees | 15,563 |
| Median Property Value | $352,000 |
Household Income
The average household income in Bell, CA grew from $38,823 to $39,686 in the past year. This data is an estimate based upon 8,921 households in Bell, CA . The chart below presents how household income is distributed in Bell, CA in comparison to the revenue allocation amid households nationally.
Property Value
According to data from last year, the average property value in Bell, CA shifted from $322,900 to $352,000 throughout the year. The subsequent graph indicates the share of properties in the given price range in Bell, CA in comparison to the median property value in the same price segment across the country. According to the data, the greatest share of Bell, CA properties falls in the '$300,000 to $399,999' range, which is higher than the most significant median property across the country.
Rent vs. Own
Property Taxes
One of the most important aspects for property owners is the amount of property taxes. This graph shows distribution of property taxes in Bell, CA compared to median property taxes around the country. The prevalent amount of property taxes in Bell, CA equals $3000, which is less than the national average.