Bellflower, CA, USA apartments for sale
$2,46M
$2,46M
Available: Right Now
Attention Investors! Perfect opportunity! Are you looking for investment properties with big upside potential for income streams. Great neighborhood, in a highly desirable rental area. Easy to rent out. Central location/ easy access to91/605/105/710/...
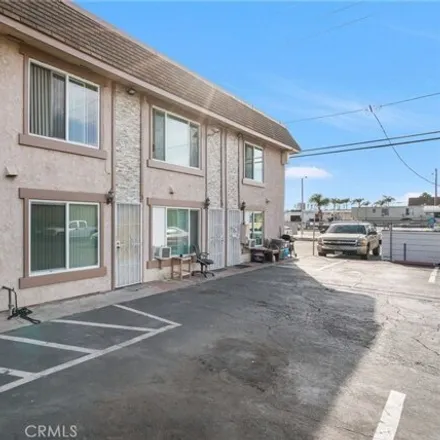
$2,5M
$2,5M
Available: Right Now
Ideally located only two lots off of the vibrant downtown of Bellflower Blvd. in Bellflower, California, this multifamily property offers an enticing investment opportunity, close walking proximity to dining and shopping, as well as convenient freewa...
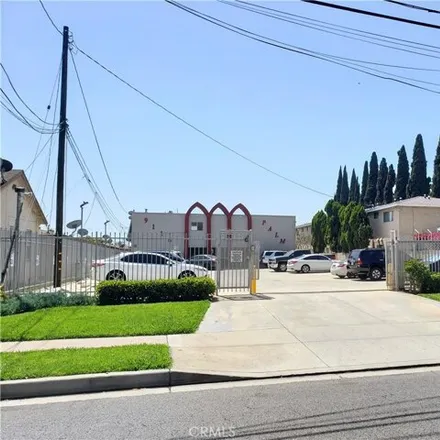
$4,2M
$4,2M
Available: Right Now
A wonderful opportunity to own a well maintained 16 unit apartment in Bellflower. 8 units are 2 Bedroom, 1.5 Bath, appox. 875 Sqft. and 8 units are 1 Bedroom, 1 Bath, approx. 620 Sqft. 5 units have patio, 5 units have balcony/deck, and 3 units have b...
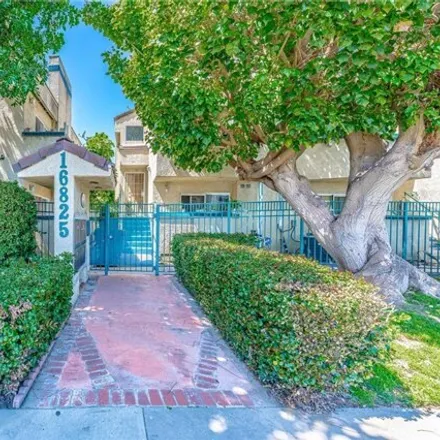
$399,000
$399,000
Available: Right Now
Welcome to your home located at 16825 Passage Ave Unit 312 in Paramount, CA. This charming 1 bedroom 1 bathroom private end unit condo offers an ideal blend of comfort and convenience. Step inside to discover a well-designed living space with natural...
$485,000
$485,000
Available: Right Now
Welcome to your beautiful new condo! Located in the desirable gated community of Benton Bay in the city of Norwalk! This completely upgraded 1 Bedroom, 1 Bathroom Condo is an end unit with brand new engineered wood flooring, new interior paint, and a...
$719,000
$719,000
Available: Right Now
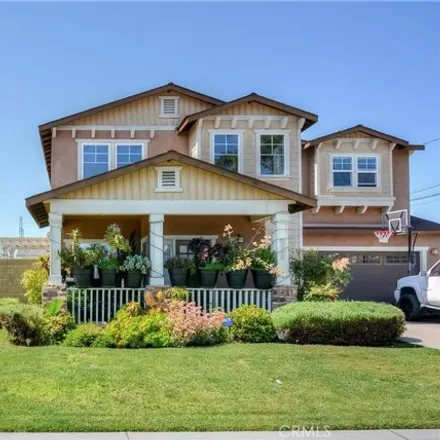
Welcome to this stunning remodeled 2-bedroom, 1-bathroom home with a bonus office room that could easily serve as a 3rd bedroom, As you step inside, you'll be greeted by a bright interior with high ceilings that create an inviting atmosphere. The rec...
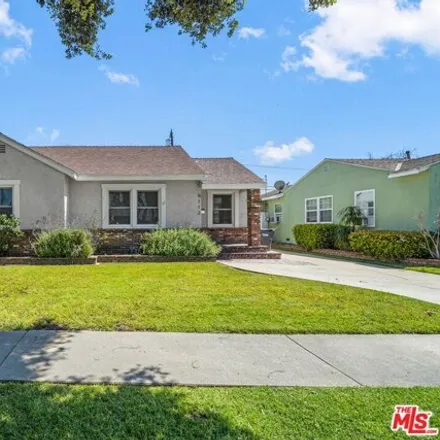
$749,900
$749,900
Available: Right Now
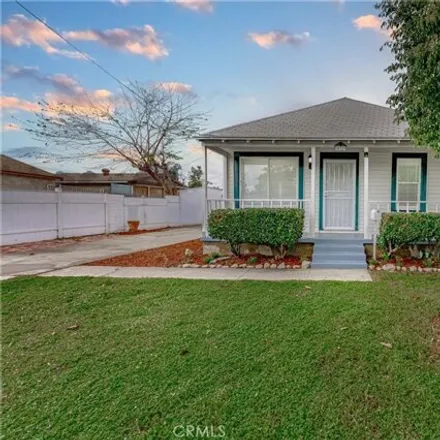
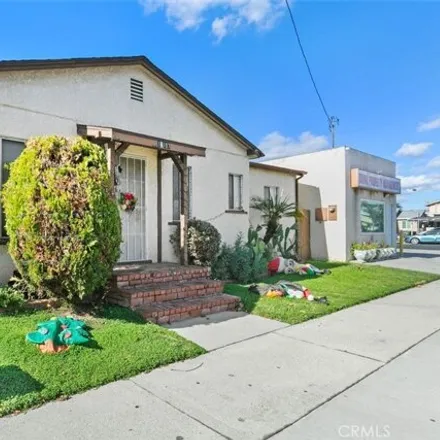
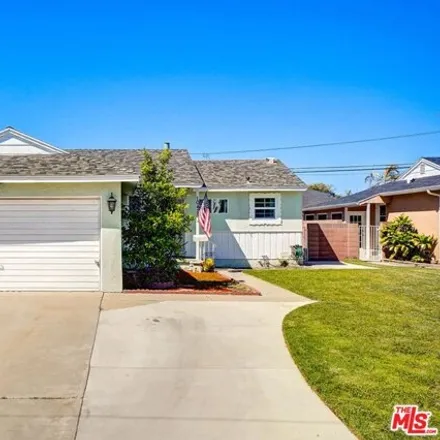
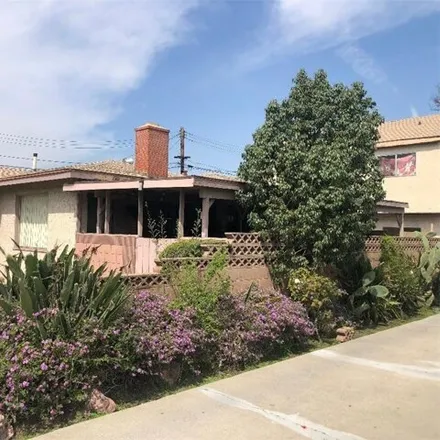
First Time this Home Has Been Available In Nearly 50 YearsDon't Miss This Value-Add Opportunity...Take At Step Back Into The Simpler Times Of 1948 and Experience This Story Book Home On Tree Lined Street In Highly Sought After North Bellflower Neighb...
$650,000
$650,000
Available: Right Now
This beautiful property features 3 bedrooms upstairs, 1/2 bath downstairs, full bath upstairs, master bedroom nice size with walk-in cedar closet with a full bathroom. the other two rooms are a nice size that will fit a king size bed and dresser w...
$839,000
$839,000
Available: Right Now
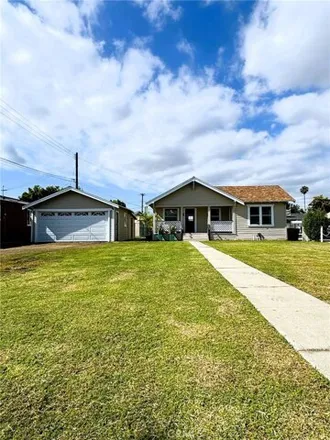
Discover the enchantment of Lakewood at 6112 Bonfair Avenue, a nicely upgraded three-bedroom gem offering the perfect blend of classic charm and modern amenities. Inside, discover spacious rooms adorned with wooden floors and upgraded double-pane win...
$892,000
$892,000
Available: Right Now
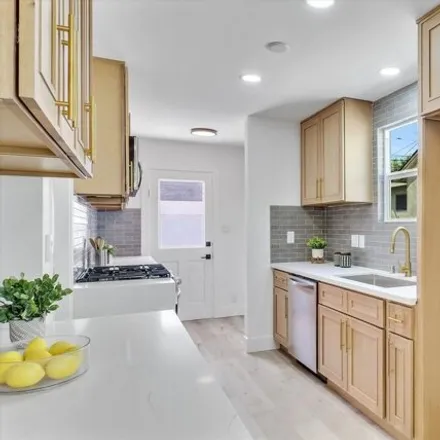
Welcome to a haven of calm and refinement. You'll immediately notice the fresh interior paint, executed in a tasteful neutral color scheme, creating a tranquil canvas for your furnishings and artwork. The living area has a fireplace, adding charm and...
$1,5M
$1,5M
Available: Right Now
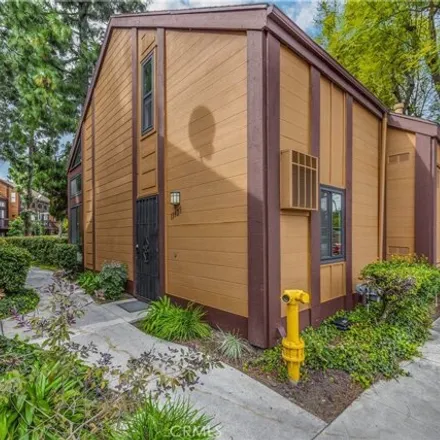
5 recently upgraded bungalow style rental units on a19, 563sf lot (Frontage:70', Depth:280') in Bellflower. The property is situated on the south side of Artesia Blvd and East of Downey Avenue. New concrete driveway with metal gate. New interior pain...
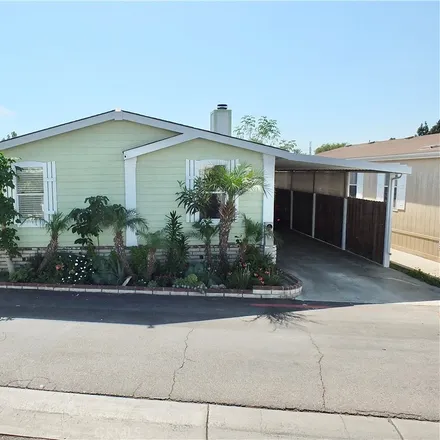
$195,000
$195,000
Available: Right Now
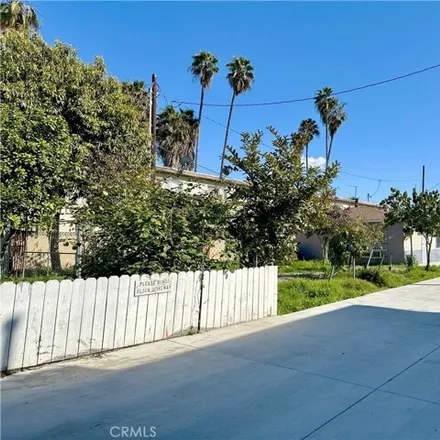
$650,000
$650,000
Available: Right Now
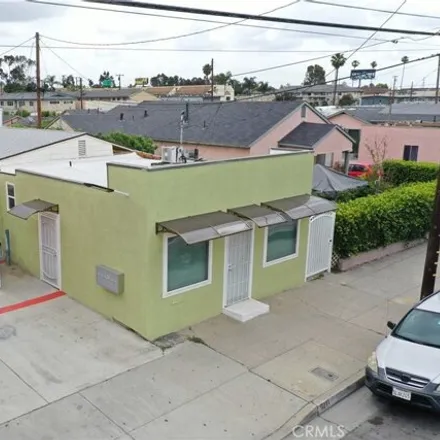
Welcome to a truly unique property opportunity in the heart of Bellflower! This distinctive lot, zoned for office building (buyer to check with city), seamlessly blends business and residential elements. With a prime location offering easy access to ...
$989,000
$989,000
Available: Right Now
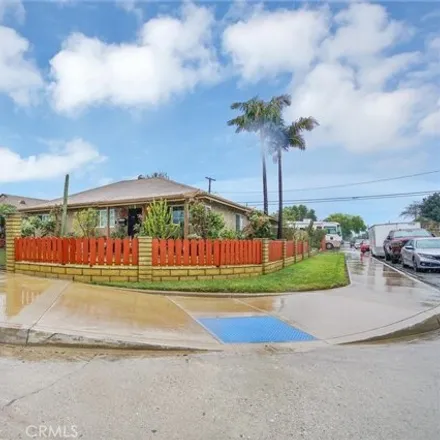
Welcome to your dream home in the heart of Bellflower! This fantastic property offers an exceptional blend of modern living and potential income generation, making it a rare find in this highly sought-after area. Situated on a generous corner lot, th...
$799,900
$799,900
Available: Right Now
Newly Upgraded Duplex with Endless Possibilities! This beautifully remodeled Duplex boasts an expansive lot spanning over8, 500sq.ft., offering ample space and potential. Each unit features 1 bedroom and 1 bath, totaling 2 bedrooms and 2 bathrooms co...
$850,000
$850,000
Available: Right Now
Step into an extraordinary opportunity to embrace the tranquility of your new sanctuary! Tucked away in a highly coveted neighborhood, this home epitomizes comfort and sophistication. Set upon a picturesque lot, it seamlessly combines contemporary up...
$1,85M
$1,85M
Available: Right Now
Attention investors! This is an extraordinary opportunity to acquire a versatile Commercial/Residential Income Property in the highly desirable City of Bellflower. You won't want to miss out on this must-see investment property, featuring 6 recently ...
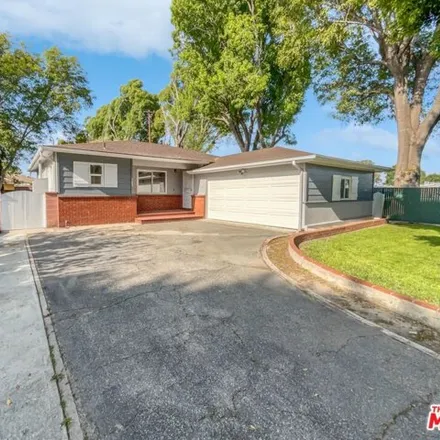
$729,900
$729,900
Available: Right Now
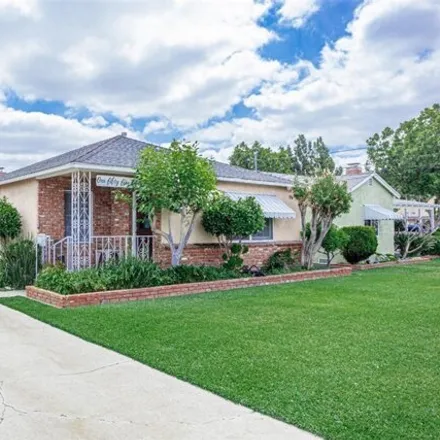
Home Sweet home! Entertainers dream with a spacious lot, both front and back, with a covered patio is ideal for hosting summer gatherings. The recent upgrades including a new kitchen, copper plumbing, and updated bathrooms and windows. add both value...
$549,000
$549,000
Available: Right Now
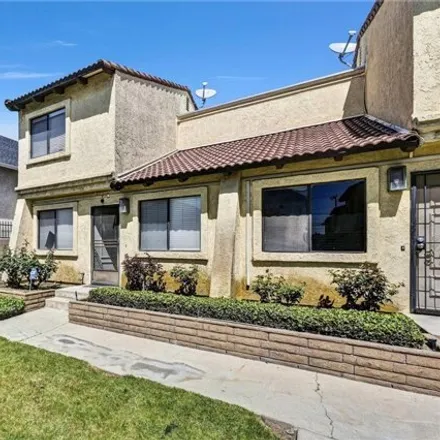
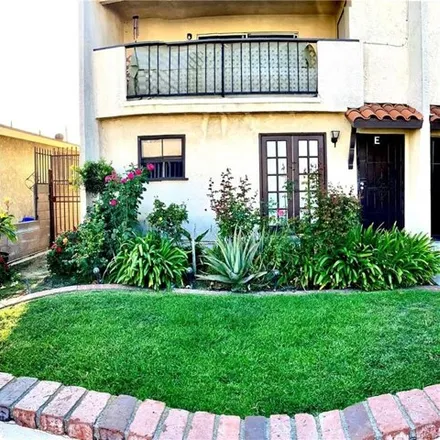
Nestled within the tranquility of a charming pool community, this inviting two-story condo offers a thoughtfully designed interior that spans 3 cozy bedrooms and 3 well-appointed bathrooms. Upon entry, the warmth of the living room greets you, with a...
$470,000
$470,000
Available: Right Now
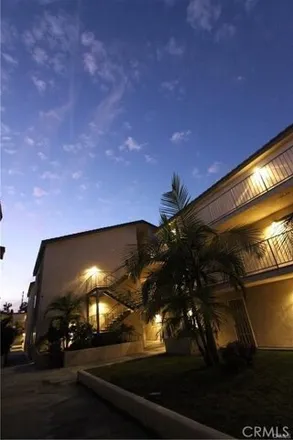
Welcome to Somerset ParamountHOA. 2bedrooms and 2 full bathrooms, in unit washer and dryer hook-ups, vaulted ceilings, located on the 2nd floor and comes with two assigned parking spaces. Gated private entrance. Enjoy the community pool, jacuzzi, clu...
$2,65M
$2,65M
Available: Right Now
Welcome to 9719 Beach St. Great opportunity here. This unique property with aHUGE 18, 995sq ft lot that has even more potential than what is already there. There is a Single-family residence in the front of property. Followed by a two story 2 unit bu...
$539,999
$539,999
Available: Right Now
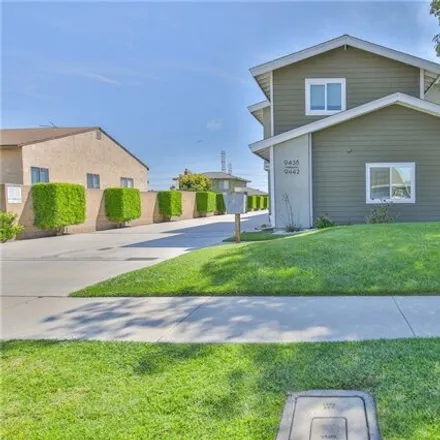
Beautiful 3bedroom 1 1/2 bath home, two stories, all bedrooms upstairs, 2 car garage attached, washer and dryer in garage, forced air and heat, kitchen dining area and living room downstairs, ceramic tile throughout home, master bedroom with a balcon...
Bellflower
According to statistics, the population in Bellflower, CA amounts to 77,852, which shows decline 0% compared to the previous year. The median age of the city’s residents is 34. The average household income is $52,944, shifting growth 4% from the past year, and the average property value in Bellflower, CA growth 8% to $398,000 throughout the year.
| Population | 77,852 |
| Median Age | 34.1 |
| Poverty Rate | 15% |
| Household Income | $52,944 |
| Number Of Employees | 35,087 |
| Median Property Value | $398,000 |
Household Income
The average household income in Bellflower, CA grew from $50,704 to $52,944 in the past year. This data is an estimate based upon 23,359 households in Bellflower, CA . The chart below presents how household income is distributed in Bellflower, CA in comparison to the revenue allocation amid households nationally.
Property Value
According to data from last year, the average property value in Bellflower, CA shifted from $367,300 to $398,000 throughout the year. The subsequent graph indicates the share of properties in the given price range in Bellflower, CA in comparison to the median property value in the same price segment across the country. According to the data, the greatest share of Bellflower, CA properties falls in the '$400,000 to $499,999' range, which is higher than the most significant median property across the country.
Rent vs. Own
Property Taxes
One of the most important aspects for property owners is the amount of property taxes. This graph shows distribution of property taxes in Bellflower, CA compared to median property taxes around the country. The prevalent amount of property taxes in Bellflower, CA equals $3000, which is less than the national average.