Bellingham, MA, USA apartments for sale
$699,900
$699,900
Available: Right Now
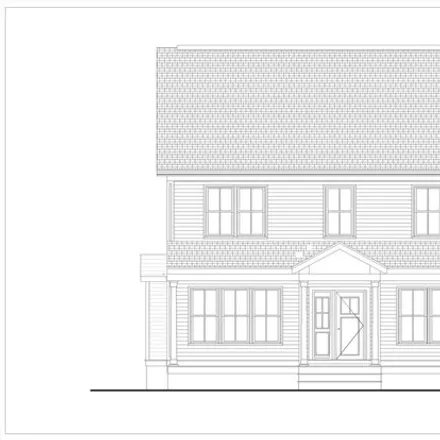
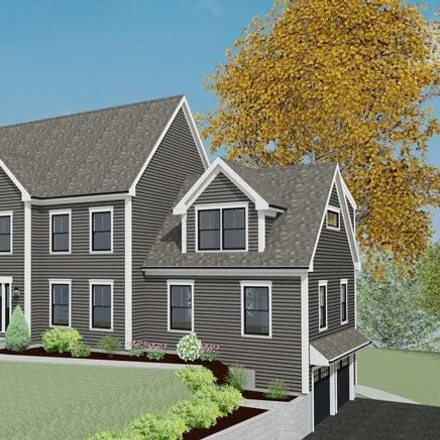
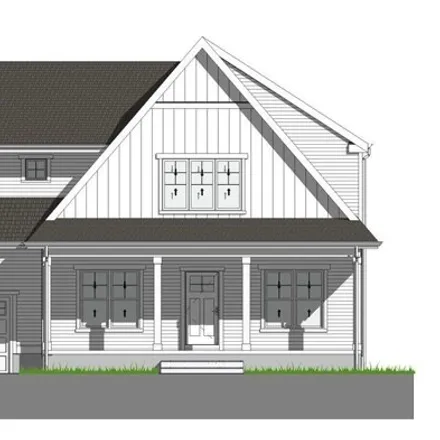
New construction to be built in Bellingham. We are offering two different style homes, one being a 2085 SqFt colonial with 3 bedrooms upstair and two full bath, and we are also offering a 2075 SqFt colonial style home with first floor master s...

$549,900
$549,900
Available: Right Now
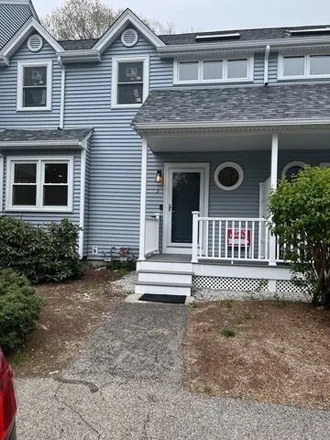
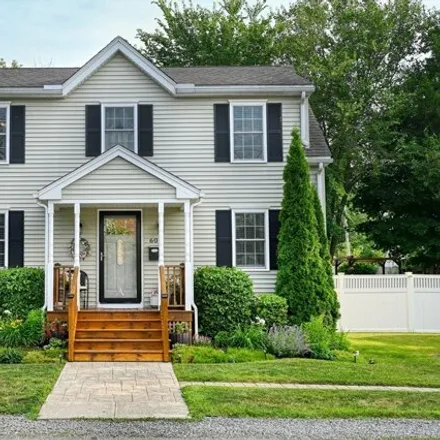
Welcome to this beautiful stand alone, detached 3 bdrm 2 and 1/2 bath home located in Bellinghams Caryville Xing condo community. This home features a large living room with hardwood floors and wood burning fireplace. Hardwoods extend thru the dining...

$1,19M
$1,19M
Available: Right Now
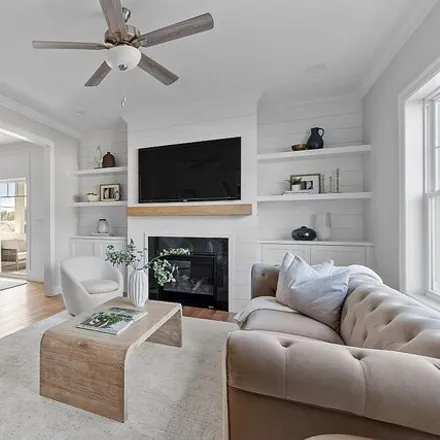
Welcome to this inviting 4 bedroom, 2.5-bath colonial-style home that embodies spaciousness and comfort. Nestled in a serene neighborhood, it boasts a thoughtful layout with an open floor plan that seamlessly connects the living, dining, and kitchen ...

$549,900
$549,900
Available: Right Now
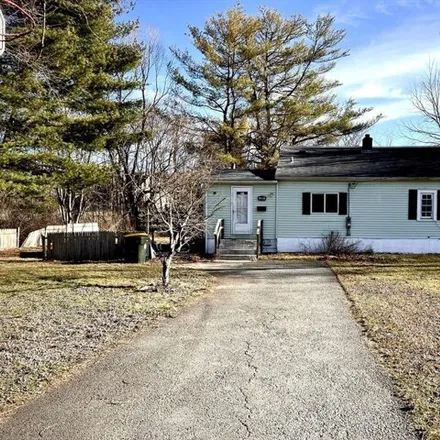
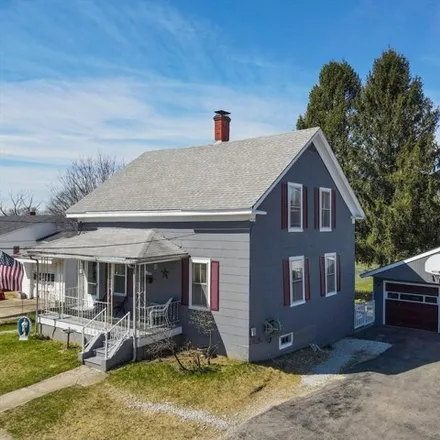
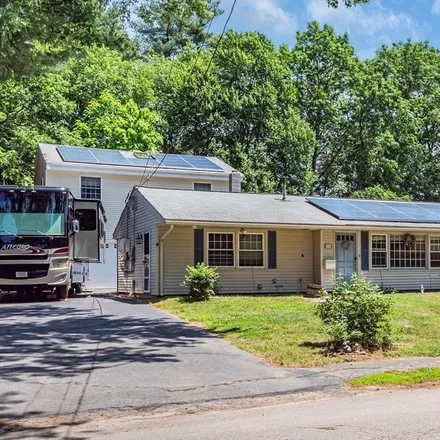
Commuters Dream! This fully updated ranch with 2 car garage under is minutes from 495 and move-in ready. Updates include new 3 bedroom septic, revamped exterior, new driveway, refinished hardwood floors, new kitchen, new bathroom, new appliances and ...

$699,900
$699,900
Available: Right Now
A Rare and Exceptional Opportunity to own a Beautiful and Landscaped Side by Side 2 Family. Multi Generational Family? Owner Occupied? You decide. If you are looking for that Open Concept feeling, then Unit 1 is for you-Brand New Kitchen with Large I...
$689,000
$689,000
Available: Right Now
Weekly Open House Thursday - Sunday 11-3 at our On Site Sales Center located in the Clubhouse------Welcome to Bellinghams newest Condominium Community. 108-unit Community consists of Triplex buildings surrounded by natural wooded beauty for desired p...
$340,000
$340,000
Available: Right Now
Welcome to one of Bellingham's most affordable homes! This property is just waiting for the next owner to take it to a new level. Upon entering the home you will be embraced by warm wood wrapping around the room with a slider to guide you onto the de...
$449,999
$449,999
Available: Right Now
Fantastic opportunity to acquire this spacious 2-bedroom, 2 1/2bath condominium situated within the professionally managed Chestnut Hill Condominiums in sought-after South Bellingham. This meticulously maintained1, 272sq. ft. residence boasts an invi...

$799,900
$799,900
Available: Right Now
Unique opportunity here in Bellingham. This cape style home comes with 33 +/- ACRES! The cape home offers three bedrooms, 1.5 bathrooms. Kitchen was updated a few years ago, roof is approx. 10 years old, hot water tank is brand new, fenced-in yard wi...

$809,900
$809,900
Available: Right Now
New construction in Bellingham! Welcome Home toHARMONY! The Layla Plan is a great family home. 4 bedrooms, including 2nd Floor Master Suite and dedicated Study. Laundry on the 2nd floor. Open concept living with vaulted ceiling in the Great Ro...
$685,000
$685,000
Available: Right Now
Weekly Open House Thursday - Sunday 11-3 at our On Site Sales Center located in the Clubhouse-------Welcome to Bellinghams newest Condominium Community. 108-unit Community consists of Triplex buildings surrounded by natural wooded beauty for desired ...

$599,900
$599,900
Available: Right Now
Meticulous attention to maintenance shines in this expansive 4-5 bed, 2 bath, split level. Gleaming oak hardwood floors guide you through an updated kitchen featuring stunning black quartz countertops. Both bathrooms have been renovated to offer a sp...

$350,000
$350,000
Available: Right Now
Discover the potential of this 3-bedroom, 1.5-bath fixer-upper on Lake Hiawatha in Blackstone, MA. With 1400 sq ft of space, this lakeside property offers endless possibilities. The open-concept living area is filled with natural light, while the kit...

$998,000
$998,000
Available: Right Now
Welcome to the Bridges at Hales Pond Estates in West Wrentham! This 4 bed, 2.5 bath colonial with stunning farmers porch, manicured grounds, and 3 car garage is a show stopper! This home boasts high ceilings with beautiful wainscot throughout the din...
$550,000
$550,000
Available: Right Now
This South Bellingham home was all remodeled in 2009 and meticulously maintained, so there is nothing to do but move in. Quiet, dead-end street close to shopping, schools, banking, restaurants, etc. The spacious, sunlit living room has beautiful wood...
$497,000
$497,000
Available: Right Now
Experience tranquility in this Blackstone Antique on more than half acre of land. This 1240 Sqft home with 4 spacious bedrooms and 1 bath offers great potential. Additional bonus space in walk-out basement not included in sqft. Newer Oil Burner and O...
$1,19M
$1,19M
Available: Right Now
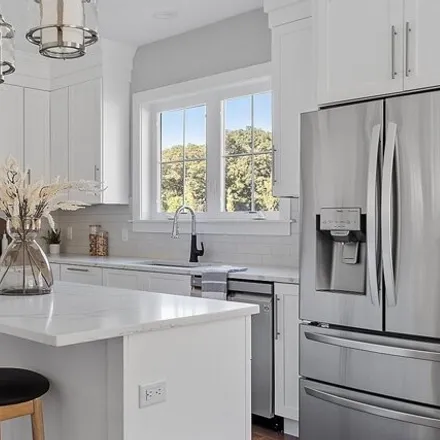
Welcome Home To This Incredible 4 Bedroom / 3.5 Bath New Construction By Local Quality Builder! Enjoy Upgrades Galore From The Moment You Step Inside Your Beautifully Appointed High-End Kitchen Offering Induction Range, Vented Hood, Refrigerator, Isl...
$814,900
$814,900
Available: Right Now
DON' T miss out ! New construction in Bellingham! Welcome Home toHARMONY! The Brooklyn Plan is a great family home. 4 bedrooms, including Master Suite, dedicated Study and Dining Room. Laundry on the 2nd floor. Open concept living, perf...

$725,000
$725,000
Available: Right Now
Nestled in a highly desired neighborhood, this stunning four-bed, two-bath home offers the perfect blend of comfort and luxury. Step inside the expansive open floor plan that seamlessly connects the living, dining, and kitchen, creating an inviting s...

$500,000
$500,000
Available: Right Now
Meticulous 2 bedroomEND UNITtownhouse with 1 car garage, and an abundance of upgraded finishes. Hardwoods, crown moldings, wainscoting, neutral color palette. Beautiful antique white kitchen cabinetry with chocolate glaze, granite countertops,...

$1,19M
$1,19M
Available: Right Now
Welcome to this inviting 4 bedroom, 2.5-bath colonial-style home that embodies spaciousness and comfort. Nestled in a serene neighborhood, it boasts a thoughtful layout with an open floor plan that seamlessly connects the living, dining, and kitchen ...
$490,000
$490,000
Available: Right Now
Convenient one floor living in established neighborhood. Possibilities galore with this spacious two bedroom ranch main house. Two bedrooms are joined by a bonus room unlimited only by imagination; perhaps a third bedroom or office. Formal living roo...
Bellingham
According to statistics, the population in Bellingham, MA amounts to 5,246, which shows decline -2% compared to the previous year. The median age of the city’s residents is 43. The average household income is $84,914, shifting growth 12% from the past year, and the average property value in Bellingham, MA growth 2% to $251,400 throughout the year.
| Population | 5,246 |
| Median Age | 43.3 |
| Poverty Rate | 3% |
| Household Income | $84,914 |
| Number Of Employees | 2,872 |
| Median Property Value | $251,400 |
What is the Average Price of Apartments for Sale in Bellingham, MA?
| Month | Median Price |
|---|---|
| Jun 2024 |
$445,563
|
| May 2024 |
$510,537
|
| Apr 2024 |
$625,887
|
| Mar 2024 |
$625,887
|
| Feb 2024 |
$625,887
|
| Jan 2024 |
$625,887
|
| Month | Median Price |
|---|---|
| Jun 2024 |
$775,090
|
| May 2024 |
$1,193,596
|
| Apr 2024 |
$811,508
|
| Mar 2024 |
$811,508
|
| Feb 2024 |
$811,508
|
| Jan 2024 |
$811,508
|
Household Income
The average household income in Bellingham, MA grew from $75,938 to $84,914 in the past year. This data is an estimate based upon 2,106 households in Bellingham, MA . The chart below presents how household income is distributed in Bellingham, MA in comparison to the revenue allocation amid households nationally.
Property Value
According to data from last year, the average property value in Bellingham, MA shifted from $246,300 to $251,400 throughout the year. The subsequent graph indicates the share of properties in the given price range in Bellingham, MA in comparison to the median property value in the same price segment across the country. According to the data, the greatest share of Bellingham, MA properties falls in the '$200,000 to $249,999' range, which is lower than the most significant median property across the country.
Rent vs. Own
Property Taxes
One of the most important aspects for property owners is the amount of property taxes. This graph shows distribution of property taxes in Bellingham, MA compared to median property taxes around the country. The prevalent amount of property taxes in Bellingham, MA equals $3000, which is less than the national average.