Belmont, MA, USA apartments for sale

$1,8M
$1,8M
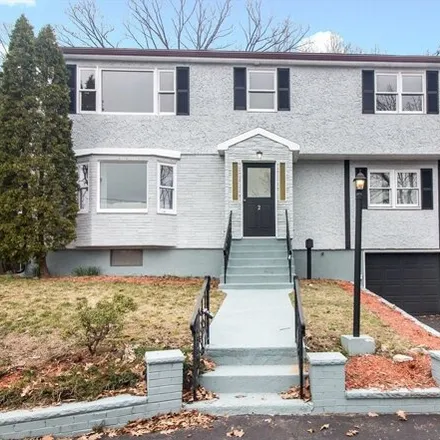
Available: Right Now
Fantastic opportunity to purchase a spacious Ranch in Belmont Hill Area on a beautifully landscaped private just under an acre39, 792sqft lot. This home awaits your personal touch with potential for increase equity. Featuring freshly refinished gleam...

$2,6M
$2,6M
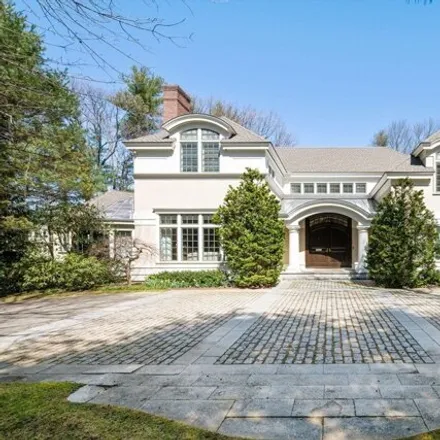
Available: Right Now
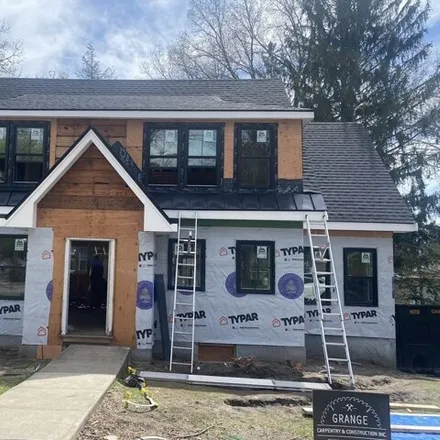
Newly built, corner lot contemporary colonial in Winn Brook neighborhood, completed in '23. This 4 bedrm, 5 bthrm home is less than a 10 min walk to Belmont center and has convenient access to rt 2 and Cambridge. This home offers an open and free flo...

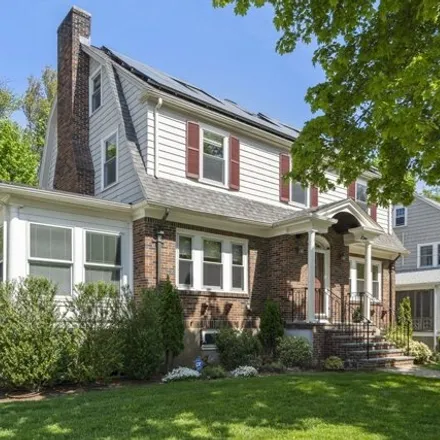
$1,75M
$1,75M
Available: Right Now
Beautifully renovated charming brick Tudo-style home sits on a beautifully landscaped corner lot seamlessly blending period details and modern design boasting 3 beds 3 baths and an office. Open floor plan. Central HVAC. Hardwood floor. Updated window...

$2,6M
$2,6M
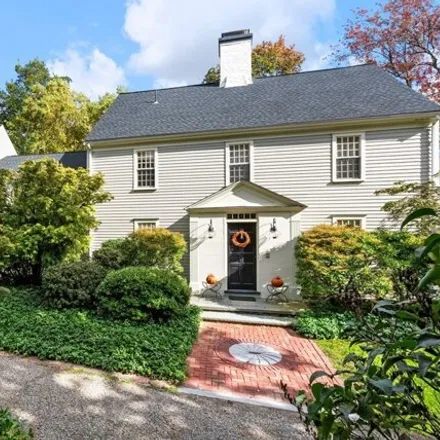
Available: Right Now
Handsomely sited in an idyllic neighborhood; this nine-room, five-bedroom residence has been gut-renovated by a local building team. The tastefully appointed interiors offer a living room with fireplace and sliders leading to lush gardens and outdoor...
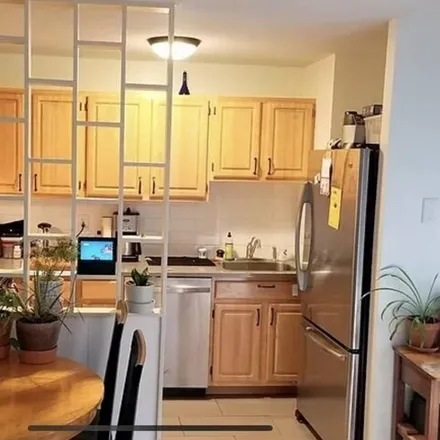
$525,000
$525,000
Available: Right Now
Sold as an investment property only until August30, 2024.The tenancy will transfer to the new owner(s). Monthly rent$2, 495.This is a first-floor unit, featuring an open space plan including living room/dining area and kitchen. The living area opens ...
$1,83M
$1,83M
Available: Right Now
Belmont Hill, this handsome nine room home is sited on a tranquil tree lined street. Beautifully appointed with period detail while tastefully and meticulously renovated to reflect today's modern lifestyle. The welcoming foyer opens into a gracious l...

$930,000
$930,000
Available: Right Now
Discover this unique, well-cared-for 3-bedroom condo across from Belmont Upper middle school and Belmont High School. The main floor features spacious, bright rooms with high cathedral ceilings, 1.5 bathrooms, a cozy living room with a fireplace, a f...

$1,08M
$1,08M
Available: Right Now
Desirable location close to Cushing Square and a mile to Belmont Center! This charming, well maintained 1920 Colonial welcomes you with an oversized entry porch. Foyer opens to the living room with fireplace. Bright sunroom, dining room, eat in kitch...

$725,000
$725,000
Available: Right Now
Meticulously maintained, this two-bedroom condo offers an exceptional opportunity for savvy buyers. The property boasts the potential to expand with a third-floor space and a second bathroom, adding value and enhancing comfort. Recent upgrades includ...
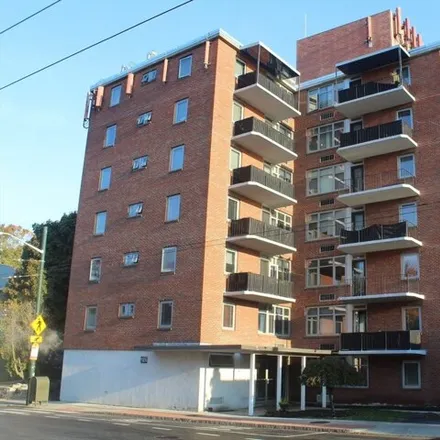
$475,000
$475,000
Available: Right Now
Offered as an investment property only until October 30th, 2024.Signed standard lease 12-months contract, $1, 995/month (annual income$23, 940). The property is located on the 4th floor, facing Trapelo Rd. Laundry in building on the first floor near ...
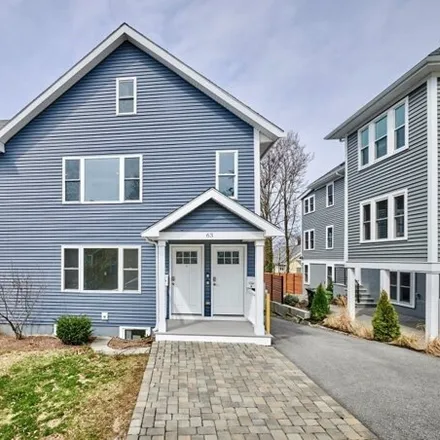
$1,1M
$1,1M
Available: Right Now
Welcome to 63 Bradford Road, Unit 2. Located on a quiet street between Oakley Country Club and the Cambridge line. As close to new construction as you an get, fully renovated down to the studs in 2021 with nothing but luxury, quality and perfection i...

$1,2M
$1,2M
Available: Right Now
This spectacular 3 bed/2.5 bath Belmont classic colonial in Kendall Gardens is THE ideal location. Upgraded and expanded with a two story addition (2019-2020), this home boasts a gorgeous new open floor plan with brilliant kitchen featuring center ve...

$1,79M
$1,79M
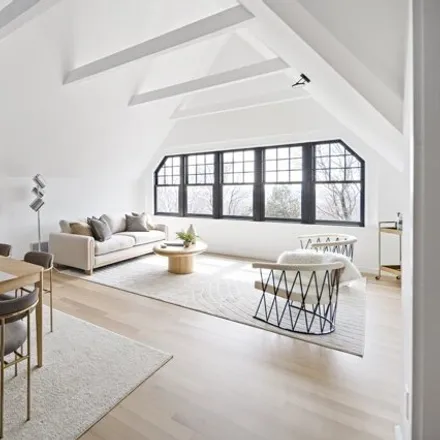
Available: Right Now
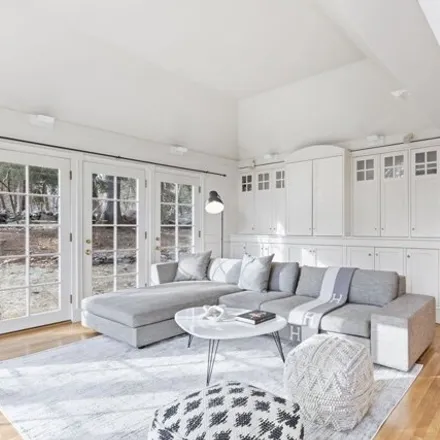
This meticulously maintained home offers a haven for comfortable living. Expansive living room boasts a fireplace and vaulted ceilings. Formal dining area leads seamlessly into the updated kitchen, featuring a center island, granite countertops, and ...
$3M
$3M
Available: Right Now
A hidden gem perched atop Belmont Hill, this updated4, 081sq ft, 5 bed/5 1/2 bath home w zen-like grounds, makes an instant impression. It is meticulous, well loved and designed for comfortable family living and entertaining. The family area off the ...

$1,4M
$1,4M
Available: Right Now
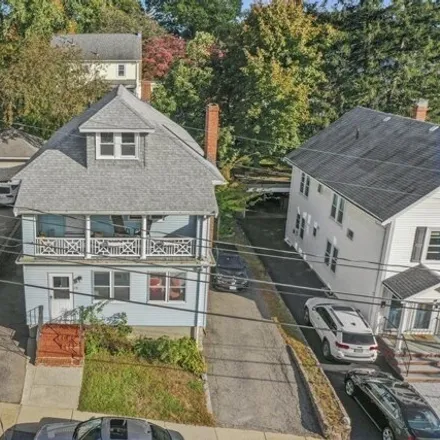
Brand New to Market! By appointment only. Location! Location! Location! Rare Opportunity to own 3 family in one of the towns most sought after locations! Perfect for Investors or owner occupant who want to create future equity! Located in the Desirab...
$6,9M
$6,9M
Available: Right Now
Welcome to your private sanctuary nestled amidst lush greenery and located nine miles outside of Boston. This home is a blend of styles, with an attention to detail and boasts an open plan. The house is set on a gorgeous 60K+ square foot lot with its...
$1,35M
$1,35M
Available: Right Now
Sophisticated top-floor 2 bedroom, 2 bath condominium at Payson Estate. Elevator building with one-floor living affords all-day sun from full Southern exposure. This residence has been meticulously renovated to the studs with high-end European cabine...
$1,3M
$1,3M
Available: Right Now
Welcome to your newly renovated 5-bedroom, 3 full and 1 half bath haven in the heart of Arlington Heights! This home boasts modern luxury with two cozy fireplaces, including one nestled in the finished basement where you can unwind with family and fr...
$2,5M
$2,5M
Available: Right Now
Early to mid august 2024 Completion!Belmont Premiere Belmont Hill/Center neighborhood!Meticulously designed and renovated with an open elegant concept.Open and inviting flow exists throughout the home with sophisticated craftsman details and c...
$589,000
$589,000
Available: Right Now
Discover your dream condo in Watertown! As you step inside this delightful 2-bedroom, 1-bathroom first floor condo, you're greeted by a warm and inviting living room with a fireplace and hardwood floors throughout - providing a comfortable area to re...
$3,2M
$3,2M
Available: Right Now
Stunning brick and slate Tudor Revival style property, sited on an acre and half of lush grounds and mature trees. This two-story hip-roofed structure w/multiple gables andentrance w/stonework was designed by noted architect Edward Hennan. A beautifu...

$849,995
$849,995
Available: Right Now
Move right in to this meticulous first floor condo in desirable Harvard Lawn! This sunny and spacious home with newly finished hardwood floors has been delightfully renovated and freshly painted. There is a welcoming front entryway, fireplaced living...
Belmont
According to statistics, the population in Belmont, MA amounts to 25,965, which shows growth 2% compared to the previous year. The median age of the city’s residents is 42. The average household income is $118,370, shifting growth 4% from the past year, and the average property value in Belmont, MA growth 7% to $759,500 throughout the year.
| Population | 25,965 |
| Median Age | 41.6 |
| Poverty Rate | 6% |
| Household Income | $118,370 |
| Number Of Employees | 13,184 |
| Median Property Value | $759,500 |
What is the Average Price of Apartments for Sale in Belmont, MA?
| Month | Median Price |
|---|---|
| Jun 2024 |
$489,399
|
| May 2024 |
$567,793
|
| Apr 2024 |
$523,612
|
| Mar 2024 |
$523,612
|
| Feb 2024 |
$523,612
|
| Jan 2024 |
$523,612
|
| Month | Median Price |
|---|---|
| Jun 2024 |
$1,028,010
|
| May 2024 |
$1,331,713
|
| Apr 2024 |
$1,163,910
|
| Mar 2024 |
$898,260
|
| Feb 2024 |
$898,260
|
| Jan 2024 |
$898,260
|
Household Income
The average household income in Belmont, MA grew from $114,141 to $118,370 in the past year. This data is an estimate based upon 9,728 households in Belmont, MA . The chart below presents how household income is distributed in Belmont, MA in comparison to the revenue allocation amid households nationally.
Property Value
According to data from last year, the average property value in Belmont, MA shifted from $711,200 to $759,500 throughout the year. The subsequent graph indicates the share of properties in the given price range in Belmont, MA in comparison to the median property value in the same price segment across the country. According to the data, the greatest share of Belmont, MA properties falls in the '$500,000 to $749,999' range, which is higher than the most significant median property across the country.
Rent vs. Own
Property Taxes
One of the most important aspects for property owners is the amount of property taxes. This graph shows distribution of property taxes in Belmont, MA compared to median property taxes around the country. The prevalent amount of property taxes in Belmont, MA equals $3000, which is less than the national average.