Bethlehem, PA, USA apartments for sale

$340,000
$340,000
Available: Right Now
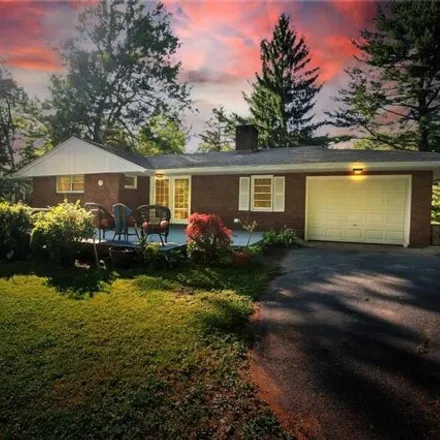
Charming Cape Cod home nestled in the heart of Hellertown, PA with hardwood floors throughout the first floor and a versatile floor plan. The outdoor entertaining areas are truly exceptional, featuring multiple conversation spaces, a fenced-in backya...

$299,900
$299,900
Available: Right Now
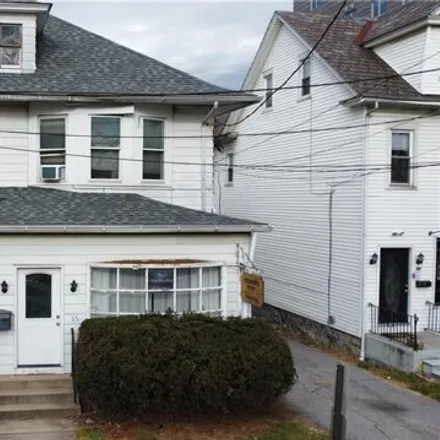
Investment property in a prime Lehigh University location. This 1600 sq ft twin unit features 4 bedrooms and 2 baths, boasting a modern, updated kitchen and bathrooms. Recent upgrades include new flooring, fresh paint, and a newer roof. Gas heat ensu...
$549,900
$549,900
Available: Right Now
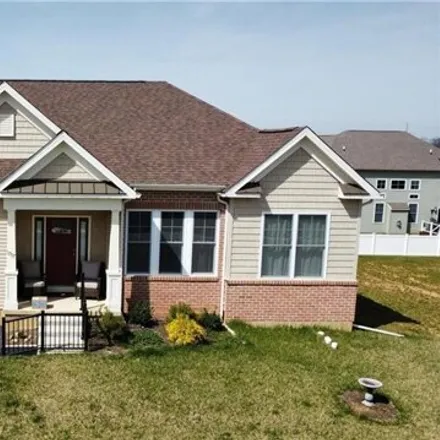
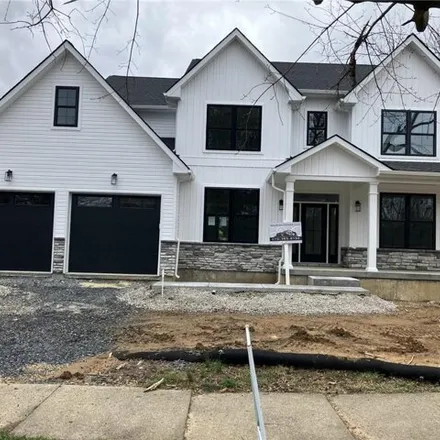
Large ranch, two years young, just waiting for a new owner to love it as much as the seller has. This home boasts 1808 sq feet with a modern open floor plan. Comfortable great room with vaulted ceilings and warming gas fireplace can be seen from the ...
$1,4M
$1,4M
Available: Right Now
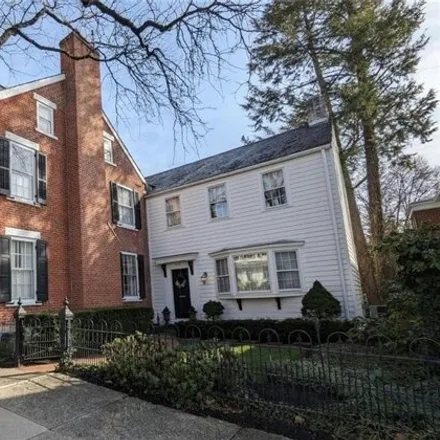
In the heart of Historic Bethlehem is sited a gem of a home in an ideal location. With its rich history dating back to 1850, this property has been meticulously maintained by the current owners with attention to the period in every inspired renovatio...
$424,000
$424,000
Available: Right Now
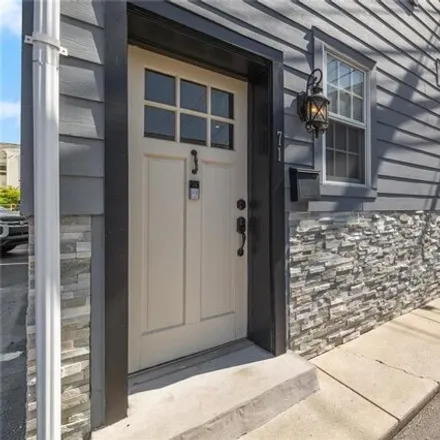
Highest and best due 06/05 1pm. Don't miss this hidden gem in the heart of Historic Bethlehem! Elegant carriage house c. 1900 and remodeled in 2017. This unique home features a 1st floor master suite with a gas fireplace, walk-in closet, and f...
$45,000
$45,000
Available: Right Now
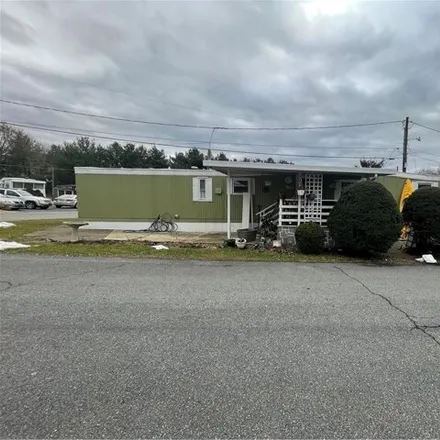
Well taken care, move in ready beautiful 2 bedroom, one bath mobile home. Easy access to highway. The owner made many updates to this property, renovated the inside, build walk in closets for each room and recently put new beams on the roof. On the o...

$425,000
$425,000
Available: Right Now
Stunning twin Home is the size and has amenities of a detached home. Unique floor plan with dramatic vaulted ceiling in living room and foyer that opens to second floor loft. Loft could be for bedroom or would make great office or computer room. Firs...

$349,000
$349,000
Available: Right Now
Welcome to this Stunning 4- bedroom, 1- bath cape cod that has been completely remodeled from top to bottom. This charming property is situated in a desirable neighborhood and offers a perfect blend of Modern amenities and Traditiona...

$320,000
$320,000
Available: Right Now
Conveniently located in the west end of Bethlehem sits this California style ranch home ready for it's new owners. Upon entering you are greeted by a nice open space which is currently used as a playroom. Could be an office or anything that fits your...
$769,900
$769,900
Available: Right Now
Dont miss this custom built colonial in bethlehems finest location. wonderful craftman like curb appeal. unique floor plan. stunning 2story family room with lots of windows. you will love the custom shaker kitchen and the oversized island. fine qu...

$875,000
$875,000
Available: Right Now
Lovely remodeled 4 bedroom, 2 1/2bathroom single home with newly-built3500 SF 5 BAYdetached garage! Property is in a quiet, but convenient location in the Saucon Valley School District. Home, currently being leased, features beautiful moldings and re...

$285,000
$285,000
Available: Right Now
Welcome to this impeccably renovated modern-twin home, nestled in the heart of Bethlehem. This stunning property offers three generously sized bedrooms, 1.5 beautifully designed bathrooms featuring exquisite tiling and an attic for extra storage. The...
$350,000
$350,000
Available: Right Now
Great mixed use opportunity or perhaps convert to all residential? Currently a medical office on first floor with multiple exam rooms and a powder room plus a spacious and bright airy apartment upstairs. Right in the middle of all the action as Morav...

$315,000
$315,000
Available: Right Now
This large detached home has been remodeled and is within walking distance of Lehigh University. Featuring new laminate flooring throughout and many upgrades, on the first floor you'll find a spacious living room (which has been used as a first floor...
$375,000
$375,000
Available: Right Now
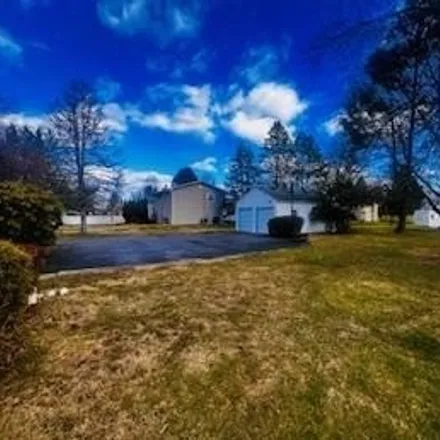
If you are looking for privacy and seclusion look no more!!! Here is your opportunity to own a Two Bedroom One Bath Ranch that sits on 3.69 Acres with a Pond!!! Enjoy the peacefulness of feeling like you are far away from everyone but in reality you ...

$294,900
$294,900
Available: Right Now
Charming single-family detached home that embodies the essence of urban convenience and suburban tranquility. Situated within walking distance to Lehigh University, SteelStacks, Wind Creek Casino, and the vibrant Southside Arts district, this residen...

$825,000
$825,000
Available: Right Now
The rich history of this c.1755 colonial, one of Bethlehem's oldest properties, is evident upon entering this distinctive home. A 1766map identifies this address as the first wheelwright shop in Bethlehem. Restored log walls and pumpkin pine floors g...

$159,900
$159,900
Available: Right Now
This 2 bedroom End of Row is ready for you to make your own or to add to your investment portfolio! Spacious bedrooms, hardwood and LVP flooring throughout, washer/dryer hookup in basement, full walk-out basement and so much more! Currently tenant oc...

$320,000
$320,000
Available: Right Now
Well maintained ranch home within Bethlehem Township! Minutes from routes309, 78, 22and the local Park and Ride into New York City! Local eateries, shopping and dining are all within a 5 minute radius! Fall in love with the park like setting and priv...

$235,000
$235,000
Available: Right Now
Very affordable single-floor living in a desirable location that is Move-In-Ready. This Ranch-twin has wonderful curb appeal, long and large covered parking (carport), large backyard with shed, California Style 10 cathedral ceilings in the living roo...

$575,000
$575,000
Available: Right Now
This is the one youve been waiting for! Completely move-in readyjust pull up the moving van and settle in. Freshly painted in neutral colors to complement any decor. New carpet throughout the entire 2nd floor and the expansive 25 x 25 finished baseme...
$470,000
$470,000
Available: Right Now
Welcome to his charming single family home nestled in Hanover Township and adjacent the beautiful municipal golf course. This delightful property offers a perfect blend of comfort, convenience, and character making it an ideal place to call home. Cur...
Bethlehem
According to statistics, the population in Bethlehem, PA amounts to 75,240, which shows decline 0% compared to the previous year. The median age of the city’s residents is 35. The average household income is $51,880, shifting growth 5% from the past year, and the average property value in Bethlehem, PA decline 0% to $168,600 throughout the year.
| Population | 75,240 |
| Median Age | 35.1 |
| Poverty Rate | 16% |
| Household Income | $51,880 |
| Number Of Employees | 35,656 |
| Median Property Value | $168,600 |
What is the Average Price of Apartments for Sale in Bethlehem, PA?
| Month | Median Price |
|---|---|
| Jun 2024 |
$433,821
|
| May 2024 |
$351,988
|
| Apr 2024 |
$298,953
|
| Mar 2024 |
$298,953
|
| Feb 2024 |
$298,953
|
| Jan 2024 |
$298,953
|
| Month | Median Price |
|---|---|
| Jun 2024 |
$425,129
|
| May 2024 |
$399,588
|
| Apr 2024 |
$332,920
|
| Mar 2024 |
$332,920
|
| Feb 2024 |
$332,920
|
| Jan 2024 |
$332,920
|
Household Income
The average household income in Bethlehem, PA grew from $49,349 to $51,880 in the past year. This data is an estimate based upon 28,936 households in Bethlehem, PA . The chart below presents how household income is distributed in Bethlehem, PA in comparison to the revenue allocation amid households nationally.
Property Value
According to data from last year, the average property value in Bethlehem, PA shifted from $168,900 to $168,600 throughout the year. The subsequent graph indicates the share of properties in the given price range in Bethlehem, PA in comparison to the median property value in the same price segment across the country. According to the data, the greatest share of Bethlehem, PA properties falls in the '$150,000 to $174,999' range, which is lower than the most significant median property across the country.
Rent vs. Own
Property Taxes
One of the most important aspects for property owners is the amount of property taxes. This graph shows distribution of property taxes in Bethlehem, PA compared to median property taxes around the country. The prevalent amount of property taxes in Bethlehem, PA equals $3000, which is less than the national average.