Bismarck, ND, USA apartments for sale
$719,900
$719,900
Available: Right Now
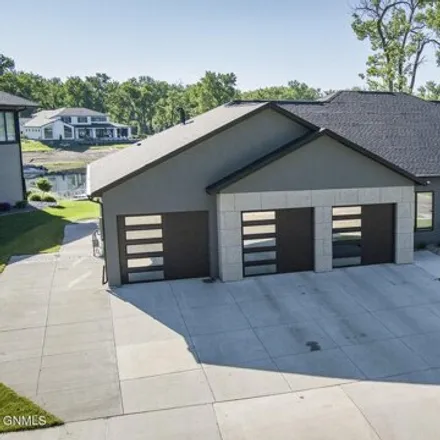
Experience luxury living in this custom-built ranch home located on a corner lot in the desirable North Bismarck. It boasts an double deep 3-stall garage spanning an impressive1, 406square feet, with space for 6 cars, is heated and insulated, and has...

$318,900
$318,900
Available: Right Now
If you are looking for character and charm, start packing your bags! This house will sure to impress with arched doorways, original sconces and light fixtures and hardwood floors. The main floor has a very functional kitchen that flows into a cozy br...

$605,000
$605,000
Available: Right Now
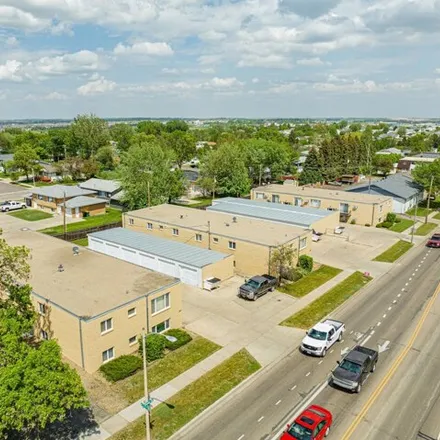
Are you looking for a great investment property... here it is ! Check out this 8 plex apartment building with a maintenance free brick exterior. Convenient location to Kirkwood Mall, restaurants, businesses, etc. There have been many updates to these...

$1,27M
$1,27M
Available: Right Now
Nestled in the prestigious community of Promontory Point, this custom-built residence offers a blend of luxury and comfort. Take a moment to appreciate the covered front porch that overlooks the rock beds of flowers and established trees. Enter throu...

$450,000
$450,000
Available: Right Now
This well designed and functional plan is sure to please. It features 3 bedrooms and 2 bath on the main floor with an unfinished basement that walks out onto a flat backyard. The main level features access to a future deck from both the dining room a...
$1,63M
$1,63M
Available: Right Now
Welcome home! One-of-a-kind luxury waterfront property with views of Fox Island Boat Ramp on the Missouri River and Whispering Bay. This stunning one-level home features 10 and 12-foot ceilings throughout, high-end artistic light fixtures, intricate ...

$419,900
$419,900
Available: Right Now
Welcome to this four bedroom, two story home in Sonnet Heights! Starting in the heart of the home, the kitchen! The kitchen has beautiful cabinets, sleek stainless steel appliances, versatile island peninsula, and a spacious pantry. The adjacent dini...
$1,5M
$1,5M
Available: Right Now
Are you looking for an Amazing Investment Property that is in amazing shape? 1914 divide ave e (6-PLEX), 2004 divide ave e (6-PLEX), 2012 DIVIDE E (6-PLEX) All included what a great deal ! Do not miss out on this 55 or older 18-u...

$289,900
$289,900
Available: Right Now
Enjoy a carefree condo lifestyle in Lakewood with Water access ! Incredible location, close to Raging Rivers Waterpark, Family Wellness, New Lakewood Elementary School and Convenience Store. Open concept, modern-neutral colors, white trim pack...

$324,500
$324,500
Available: Right Now
As you pull into the driveway, you will notice a freshly painted home with Sertoma Park located directly across the street! Inside there is much to be desired. The music on the home surround sound will be playing on your tour, and as you walk upstair...

$409,900
$409,900
Available: Right Now
Welcome to this new construction townhome located in an established neighborhood that is just waiting for you to call it home. This two-story home with a walk out basement is fully finished and provides 4 bedrooms, 4 bathrooms and 2 living rooms. Ver...

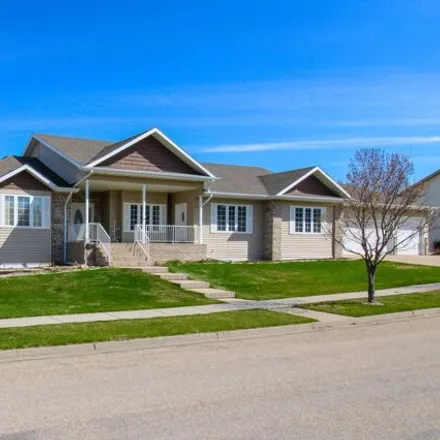
$759,900
$759,900
Available: Right Now
Welcome to your new home in the VERY coveted Promontory Point subdivision.This custom home built by Paramount Builders is a One-owner home, carefully updated and maintained by the current owners. They have taken PRIDE in this home and you will...

$498,900
$498,900
Available: Right Now
Welcome to your dream home! Currently under construction, this beautiful new build by Verity Homes features the highly sought-after Presley floorplan, offering over1, 900finished square feet of contemporary living space. Perfectly situated in a vibra...

$209,900
$209,900
Available: Right Now
TRIPLEX! Great location in Central Bismarck conveniently situated South of the Capitol, this property is located just minutes from Bismarck High School, the hospitals, the YMCA, Downtown, shopping, services and walking paths! Includes two 2-bed/ 1-ba...

$409,900
$409,900
Available: Right Now
Welcome to this new construction townhome located in an established neighborhood that is just waiting for you to call it home. This two-story with a walk out basement is fully finished and boasts 4 bedrooms, 4 bathrooms and 2 living rooms. The specia...

$439,900
$439,900
Available: Right Now
Welcome to this beautifully designed twin home, a property that combines modern living with comfort and convenience. This spacious home boasts2, 106square feet of living space, perfectly suited for a variety of lifestyles, whether you're downsizing, ...

$399,900
$399,900
Available: Right Now
Welcome to Silver ranch, your perfect home in Northeast Bismarck! We are thrilled to present this exquisite two-story twin home that boasts 3 bedrooms and 2 1/2 bathrooms. Immerse yourself in2, 017square feet of open concept living space, meti...

$324,900
$324,900
Available: Right Now
Welcome to this wonderful 4 bedroom, 2 bathroom home in south Bismarck! It has a mix of mid-century character and modern renovations. You will love the dining room addition with built-ins just off of the three-seasons porch and you will notice all of...

$189,900
$189,900
Available: Right Now
Investment or owner occupied: handyman special ! Priced well below true market ! Over/Under Duplex, including a 2 stall detached garage! The upstairs is a 3-bed unit and needs some finish work to be completed (new heater, washer dryer h...

$75,000
$75,000
Available: Right Now
Move in and enjoy this well-maintained home in Centennial Park with so much to offer! The carpets and home were freshly cleaned in March, 2024! The home is a 16X76 with 3 bedrooms and 2 baths. The many large windows provide fabulous natural light and...

$1,59M
$1,59M
Available: Right Now
Timeless luxury in North Central Bismarck. This sprawling ranch-style home sits atop Rocky Heights, with stunning views of Bismarck. The property was architecturally designed and finished with every detail in mind. The entrance is highlighted with a ...

$410,000
$410,000
Available: Right Now
This spacious ranch with attached 3 stall oversized garage welcomes you HOME! 5 bedrooms and 2 bathrooms, featuring new luxury plank vinyl throughout kitchen/dining/living room. The hot tub in back yard is hard wired up to code. Space along north sid...
Bismarck
According to statistics, the population in Bismarck, ND amounts to 70,536, which shows growth 2% compared to the previous year. The median age of the city’s residents is 37. The average household income is $61,477, shifting growth 2% from the past year, and the average property value in Bismarck, ND growth 9% to $223,200 throughout the year.
| Population | 70,536 |
| Median Age | 37.1 |
| Poverty Rate | 10% |
| Household Income | $61,477 |
| Number Of Employees | 39,102 |
| Median Property Value | $223,200 |
What is the Average Price of Apartments for Sale in Bismarck, ND?
| Month | Median Price |
|---|---|
| Jun 2024 |
$158,230
|
| May 2024 |
$181,636
|
| Apr 2024 |
$146,099
|
| Mar 2024 |
$146,099
|
| Feb 2024 |
$146,099
|
| Jan 2024 |
$146,099
|
| Month | Median Price |
|---|---|
| Jun 2024 |
$435,062
|
| May 2024 |
$360,419
|
| Apr 2024 |
$319,113
|
| Mar 2024 |
$319,113
|
| Feb 2024 |
$319,113
|
| Jan 2024 |
$319,113
|
Household Income
The average household income in Bismarck, ND grew from $60,320 to $61,477 in the past year. This data is an estimate based upon 31,368 households in Bismarck, ND . The chart below presents how household income is distributed in Bismarck, ND in comparison to the revenue allocation amid households nationally.
Property Value
According to data from last year, the average property value in Bismarck, ND shifted from $205,500 to $223,200 throughout the year. The subsequent graph indicates the share of properties in the given price range in Bismarck, ND in comparison to the median property value in the same price segment across the country. According to the data, the greatest share of Bismarck, ND properties falls in the '$200,000 to $249,999' range, which is lower than the most significant median property across the country.
Rent vs. Own
Property Taxes
One of the most important aspects for property owners is the amount of property taxes. This graph shows distribution of property taxes in Bismarck, ND compared to median property taxes around the country. The prevalent amount of property taxes in Bismarck, ND equals $2500, which is less than the national average.