Bolingbrook, IL, USA apartments for sale

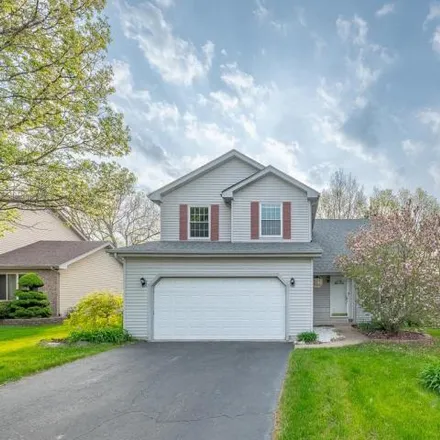
$439,900
$439,900
Available: Right Now
Absolutely gorgeous and meticulously maintained 2 story home in desirable Preserve Subdivision! Hardwood flooring and 9 ft ceilings throughout the main level. Formal living room with crown molding leads to dining room with built in cabinetry. Updated...
$349,900
$349,900
Available: Right Now
Welcome home to Haley Meadows and this spacious 2-story sanctuary complete with cathedral ceilings and room to grow. Conveniently located in North Romeoville near I-55, this 3 bed + den boasts an expansive entry and open staircase allowing tons of na...

$499,900
$499,900
Available: Right Now
Looking to have it all! This is it ! Immediately you will be impressed with this fantastic open floor plan ideal for everyday living and entertaining! Enjoy this upgraded Rare first floor master unit! This property is the perfect locati...

$1,11M
$1,11M
Available: Right Now
Brand new construction in naperville ! Aug/Sept 2024 Delivery Welcome to the Hudson, one of our most popular floorplans and for good reason! With limitless ways to make it your own, it's no wonder why so many people decide to call this floorpl...

$287,500
$287,500
Available: Right Now
This three bedroom ranch in a great family-friendly neighborhood can be yours today! You will love the gleaming wood laminate floors throughout the Living Room, Kitchen, Eat in Area, and Family Room! Brand new laminate floors in Master and Bedroom 3....

$286,000
$286,000
Available: Right Now
Gorgeous 2 story townhome with finished basement has been beautifully decorated and meticulously cared for! The soaring Vaulted foyer provides a warm welcome and leads you into the first floor living area open to dining and kitchen, perfect fo...

$549,000
$549,000
Available: Right Now
Nestled in the beautiful St. Andrews Woods subdivision of Bolingbrook, this beautifully rehabbed 3bed /2.5 bath home has been meticulously updated to meet the expectations of the most decerning of buyers. Whether you want to relax in your primary sui...

$850,000
$850,000
Available: Right Now
Gorgeous home, Plainfield Schools. Welcome to Americana Estates located adjacent to Bolingbrook Golf Club. Home features hardwood floor throughout first floor and second floor hallway. Note the Upgraded trim, doors, stone fireplace and light fixtures...

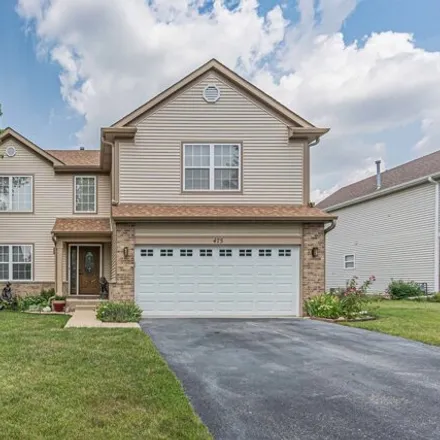
$449,900
$449,900
Available: Right Now
This is the house you have been waiting for Woodridge and Downers Grove school district Excellent location Close to schools Parks, walking trails and ponds Close to shopping The Ark The water park and 5 min to the expressway Stunning bi-level ...
$380,000
$380,000
Available: Right Now
Very Nice Extra Large 3 bedrooms 2.5 Bathroom home with a Loft that can easily become a 4th Bedroom! Large Living room with Cathedral Ceiling. Formal Dining Room. Updated Kitchen with Granite Countertops and Stainless Steel Appliances Overlooking Upd...

$339,800
$339,800
Available: Right Now
Welcome to Bolingbrook! This raised ranch, Ramsgate model, 3-bedroom home is searching for new owners. It can be yours if you respond quickly. With only 44 single family homes for sale in Bolingbrook, this one will sell quickly. The open kitchen feat...

$679,900
$679,900
Available: Right Now
Beautiful home with large Tesla Solar Panels and EV charger in Naperville Central School District # 203 and Bolingbrook Park District. It is rare to have the best of both worlds. You are greeted by a welcoming porch with a swing. The main level featu...

$405,000
$405,000
Available: Right Now
Nestled just moments away from I55 and Plainfield Schools, convenience meets tranquility in this sought-after location right off Weber road. As you approach, the serene neighborhood welcomes you with its peaceful ambiance, dotted with playgrounds and...

$389,900
$389,900
Available: Right Now
This stunning, nicely updated split level home boasts a nice open floor plan that features: A sun-filled living room; Beautiful kitchen with 42 staggered maple cabinets with crown, custom backsplash and stainless steel appliances; Formal dining room ...

$365,000
$365,000
Available: Right Now
Welcome to Bella Vista and experience maintenance free living! This beautiful open-concept style ranch-townhome (The Lockwood Model) built in 2019 features: vaulted ceilings, gas starter fireplace, kitchen with stainless steel appliances, large break...

$255,000
$255,000
Available: Right Now
This nicely updated ranch features: A spacious living room with cozy electric fireplace; Beautiful kitchen with maple cabinets, pantry and all appliances; Master bedroom with double closets; Updated bath; French door access to the privacy fenced yard...

$349,900
$349,900
Available: Right Now
WOW!! What a gem!! This home offers 4 bedrooms 2 full bathrooms and 1 car garage. This home offers new cabinets with quartz counter tops and backsplash, wrap around SS kitchen sink, SS appliances, new showers, new laminated flooring through out, fres...

$349,900
$349,900
Available: Right Now
This freshly painted 5-bedroom, 2-bathroom raised ranch is ready for you to call home. The main level features new flooring and new stainless steel appliances in the kitchen. Each bedroom is spacious, perfect for a growing family or a home office. Th...

$789,900
$789,900
Available: Right Now
This gorgeous Naperville home ideally situated steps from River Woods Elementary in acclaimed District 203 features a stunning open floor plan with many recent updates, inside and out. Updated highlights include new floors and white baseboards throug...

$390,000
$390,000
Available: Right Now
Get ready to be charmed by this home. Comfortably nestled on a quiet and welcoming cul-de-sac, with dapples and splashes of sunlight filtering through a high canopy of gently swaying mature trees. As you approach, you're drawn in by the strong curb a...

$584,900
$584,900
Available: Right Now
Stunning 4-Bedroom Home in Bolingbrook - Move-In Ready! Welcome to this beautifully maintained 4-bedroom, 2.5-bathroom home in the heart of Bolingbrook. This move-in-ready gem combines spacious living, modern amenities, and elegant design, making it ...

$419,900
$419,900
Available: Right Now
This townhouse is absolutely stunning! The 2-story family room, fireplace and abundance of sunlight with ample windows makes it the perfect place to call home! Featuring a large kitchen with white cabinets, suite of stainless appliances, mud room wit...
Bolingbrook
According to statistics, the population in Bolingbrook, IL amounts to 74,548, which shows decline 0% compared to the previous year. The median age of the city’s residents is 35. The average household income is $83,419, shifting growth 4% from the past year, and the average property value in Bolingbrook, IL growth 3% to $209,200 throughout the year.
| Population | 74,548 |
| Median Age | 35 |
| Poverty Rate | 8% |
| Household Income | $83,419 |
| Number Of Employees | 39,063 |
| Median Property Value | $209,200 |
What is the Average Price of Apartments for Sale in Bolingbrook, IL?
| Month | Median Price |
|---|---|
| Jun 2024 |
$329,688
|
| May 2024 |
$307,177
|
| Apr 2024 |
$351,965
|
| Mar 2024 |
$351,965
|
| Feb 2024 |
$351,965
|
| Jan 2024 |
$351,965
|
| Month | Median Price |
|---|---|
| Jun 2024 |
$392,932
|
| May 2024 |
$377,814
|
| Apr 2024 |
$418,850
|
| Mar 2024 |
$418,850
|
| Feb 2024 |
$418,850
|
| Jan 2024 |
$418,850
|
Household Income
The average household income in Bolingbrook, IL grew from $80,285 to $83,419 in the past year. This data is an estimate based upon 22,123 households in Bolingbrook, IL . The chart below presents how household income is distributed in Bolingbrook, IL in comparison to the revenue allocation amid households nationally.
Property Value
According to data from last year, the average property value in Bolingbrook, IL shifted from $202,900 to $209,200 throughout the year. The subsequent graph indicates the share of properties in the given price range in Bolingbrook, IL in comparison to the median property value in the same price segment across the country. According to the data, the greatest share of Bolingbrook, IL properties falls in the '$200,000 to $249,999' range, which is lower than the most significant median property across the country.
Rent vs. Own
Property Taxes
One of the most important aspects for property owners is the amount of property taxes. This graph shows distribution of property taxes in Bolingbrook, IL compared to median property taxes around the country. The prevalent amount of property taxes in Bolingbrook, IL equals $3000, which is less than the national average.