Bowling Green, KY, USA apartments for sale
$489,900
$489,900
Available: Right Now
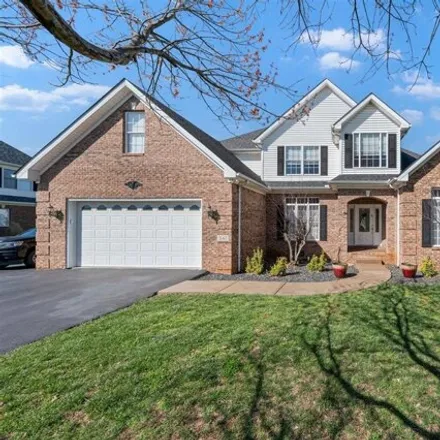
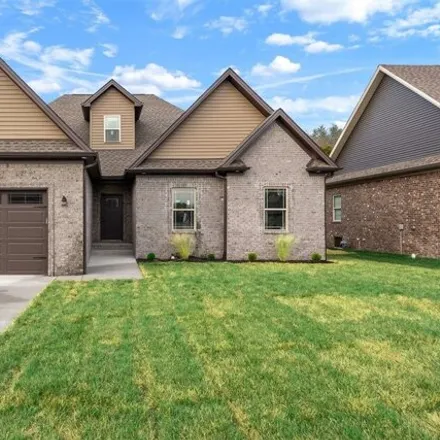
Welcome to 547 Golfview Way in Bowling Green, Kentucky's Hidden River Subdivision. This meticulously maintained home, located in the sought-after South Warren School District, offers a perfect blend of comfort and style. Inside, you'll find four bedr...
$399,900
$399,900
Available: Right Now
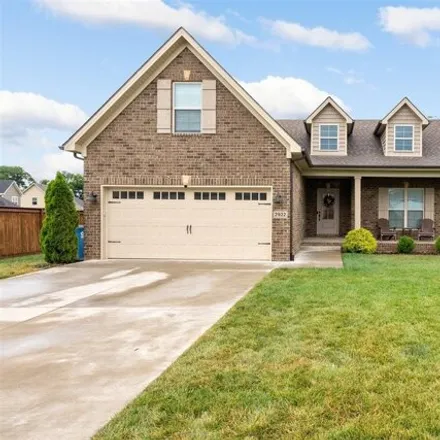
Check out this meticulously maintained brick home in South Warren. This 3 bedroom, 3 bath Hammer Home is located in the desirable Windsor Trace Farms Subdivision, and features a large bonus room, granite countertops, engineered wooden floors, stainle...

$349,000
$349,000
Available: Right Now
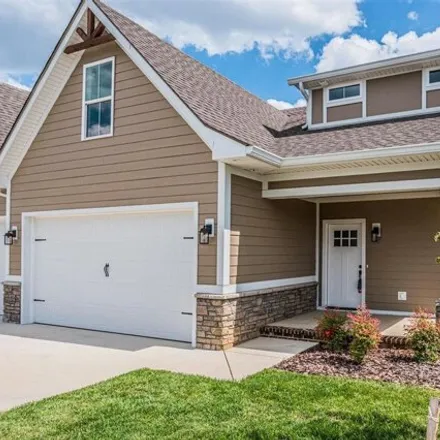
This exceptional home boasts a wealth of desirable features that are sure to captivate any potential homeowner. From the moment you step inside, you'll be greeted by an abundance of natural light that enhances the spaciousness of this 4-bedroom, 2-ba...

$345,000
$345,000
Available: Right Now
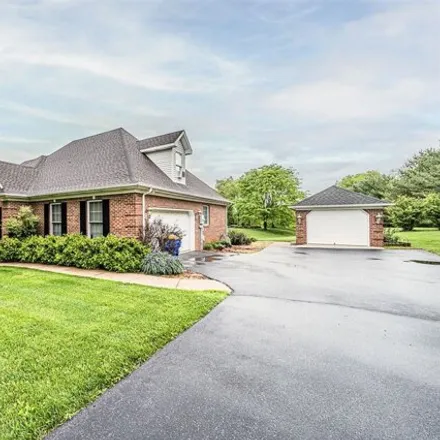
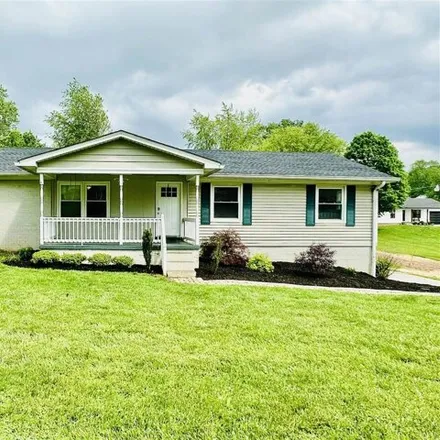
4 Bedroom/2 1/2 bath home just 1 year old. Open floor plan with beautiful porcelain tile and LVT. Vaulted family room, granite kitchen counter tops. Large 19'7x10 covered patio with additional large composite deck. This home features a split bedroom ...
$349,900
$349,900
Available: Right Now
Welcome to Covington Farms where life is relaxing. This exquisite 3 bedroom Twinhome offers unparalleled elegance and modern comfort. The main living area boasts an open layout that seamlessly connects the living room, dining area, and kitchen. Situa...
$449,000
$449,000
Available: Right Now
This very well maintained 4 bedroom and 3 full bath home in South Warren County features hardwood, granite countertops, eat-in kitchen plus dining room. The home boasts a large 1.0 +/- acre corner lot with attached 2 car garage and detached one car g...
$449,900
$449,900
Available: Right Now
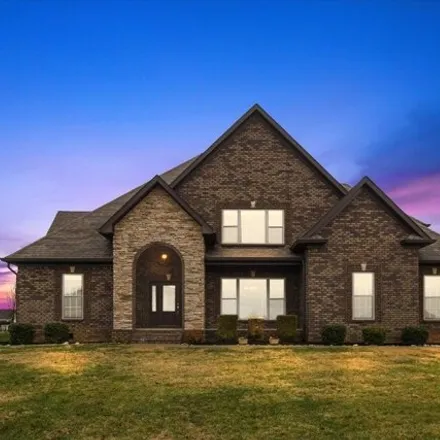
Welcome to your dream home! This custom, all brick 4-bedroom 2-bathroom home is everything youve been looking for and more. It is designed with both luxury and the most beautiful finishes. Not only does this home encompass a grand entryway and a spac...

$333,900
$333,900
Available: Right Now
Charming home located on a peaceful dead end street directly off the parkway. Just minutes from GM, Transpark, and I65. This home sits on 1.383 acres and is just minutes from great schools and shopping!! Home at 514 Sweeney and adjoining lot at 502 S...

$309,900
$309,900
Available: Right Now
This is it! An almost new 3 bed 2 bath, all brick, move in ready house! It's in the middle of everything but still in South Warren school district. This house is a split bedroom plan, that includes all appliances - even the washer and dryer and fridg...

$399,000
$399,000
Available: Right Now
This stunning 5 bedroom, 2.5 bathroom residence offers the perfect blend of comfort, style, and functionality. Situated in the heart ofBowling Green, you will be minutes from restaurants, shopping, Western Kentucky University, and our beautiful parks...

$100,000
$100,000
Available: Right Now
Opening bid: $100, 000 ~ Upcoming auction ~ ~Investment Opportunity!~3 Bed/1 Bath~Storage Shed selling w/ property~Fenced Backyard~Buyer's Agent's Welcome~ Bid in person or online Auction Date: Thursday, July 11th@ 5:15 pm. open hous...

$189,900
$189,900
Available: Right Now
Discover the perfect blend of comfort and style in this charming home that features new laminate flooring, an updated bathroom, and a brand-new tankless water heater. With its open floor plan, vaulted ceilings, and covered front porch, this home offe...
$626,000
$626,000
Available: Right Now
Welcome home to 614 Diamond Peak Drive, located in the desirable The Summit subdivision! This spacious 4 bedroom, 3 bathroom home boasts almost 3000 square feet on a.50 acre lot. Enjoy the convenience of two split bedrooms and two bathrooms on the ma...
$239,900
$239,900
Available: Right Now
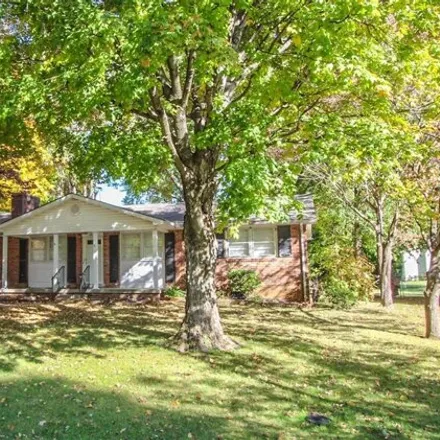
Welcome to Shawnee Estates, one of Bowling Green Ky's first subdivisions developed in around the 1960's. This subdivision features amazing scenery which includes mature trees, overly wide streets, larger lots than most newly developed subdivisions, d...
$350,000
$350,000
Available: Right Now
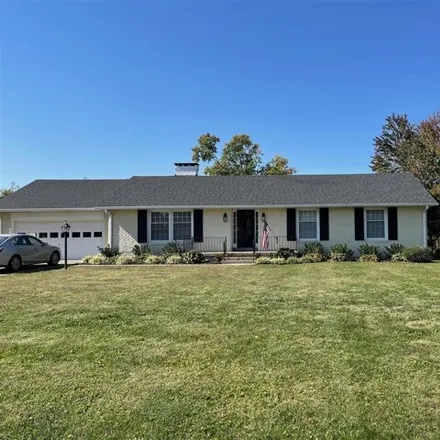
Magnificent ALL Brick better than new 3 Bed/ 2 Bath home in one of the most desirable areas of Warren County. Great schools (South Warren and Jody Richards), convenient to everything, open floor plan, and ready for the lucky next owner. This is a ter...

$239,000
$239,000
Available: Right Now
Move in ready And affordable !!! You do not want to miss this wonderful home in one of the Most desirable areas in Warren County. This home offers a beautiful interior, with spacious rooms. An outdoor area for plenty of entertainment space, an...
$319,000
$319,000
Available: Right Now
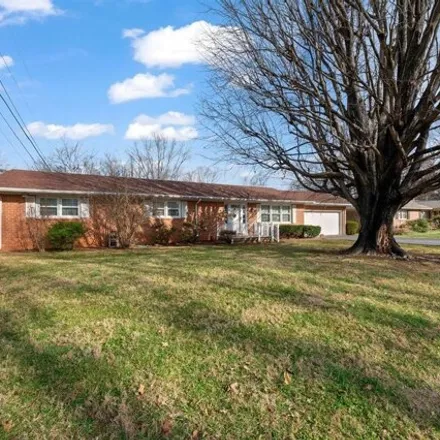
4 bedroom, 3 bath home on a spacious lot with a fenced in back yard. This property includes an attached garage/carport with an additional large detached shop with dual garage doors. This Home was fully remodeled in 2019 and it features a modern, open...
$347,000
$347,000
Available: Right Now
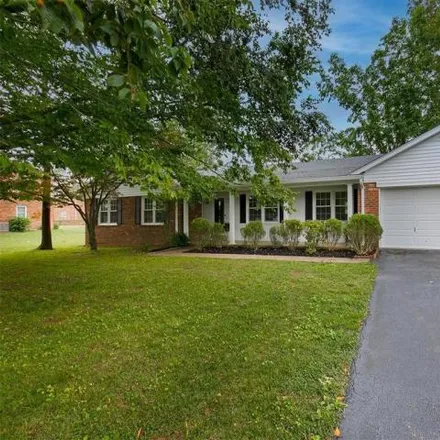
Beautiful ranch in sought after neighborhood close to everything. A short walk to either Kereiakes or Covington Parks. Large fenced in backyard ready for pets or a pool. Well maintained interior with large rooms and a second full bath in the master b...
$314,900
$314,900
Available: Right Now
Classic Briarwood ranch centrally located minutes from Bowling Green's best shopping, dining, downtown and beautiful parks. This home boasts a new roof, new HVAC, fresh paint, updated lighting and refinished hardwood throughout. Situated on a large l...
$349,900
$349,900
Available: Right Now
Welcome to this 1960's charmer that blends modern updates with nostalgic character. Located on a dead end street in the desirable city school district, this partially remodeled residence surprises with its unassuming exterior, concealing over 2700 sq...
$319,900
$319,900
Available: Right Now
This charming home located in Lake Ayre subdivision is ready for new owners! The spacious house features approx. 2, 019sq ft including 3 bedrooms, 2 bathrooms, family room, den, formal dining room, and eat in kitchen. Sitting on a large 0.47 acre lot...

$349,900
$349,900
Available: Right Now
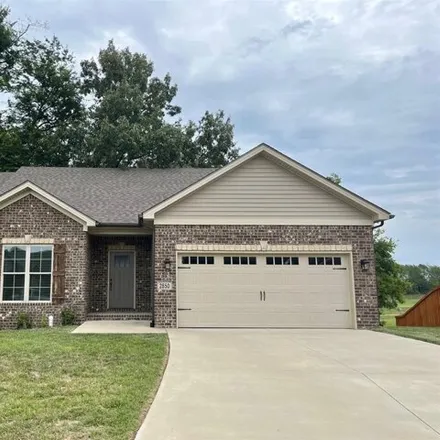
Now offering up to$5, 000towards buyers closings or rate buy down, and an extended 4 year new construction home warranty administered by Home Warranty Inc. This beautifully crafted 3 bedroom, 2 bathroom house boasts an open floor plan. The modern des...
Bowling Green
According to statistics, the population in Bowling Green, KY amounts to 64,302, which shows growth 2% compared to the previous year. The median age of the city’s residents is 27. The average household income is $39,901, shifting growth 7% from the past year, and the average property value in Bowling Green, KY growth 1% to $145,500 throughout the year.
| Population | 64,302 |
| Median Age | 27.2 |
| Poverty Rate | 26% |
| Household Income | $39,901 |
| Number Of Employees | 30,407 |
| Median Property Value | $145,500 |
What is the Average Price of Apartments for Sale in Bowling Green, KY?
| Month | Median Price |
|---|---|
| Jun 2024 |
$286,108
|
| May 2024 |
$288,416
|
| Apr 2024 |
$286,538
|
| Mar 2024 |
$286,538
|
| Feb 2024 |
$286,538
|
| Jan 2024 |
$286,538
|
| Month | Median Price |
|---|---|
| Jun 2024 |
$409,183
|
| May 2024 |
$290,248
|
| Apr 2024 |
$338,089
|
| Mar 2024 |
$338,089
|
| Feb 2024 |
$338,089
|
| Jan 2024 |
$338,089
|
Household Income
The average household income in Bowling Green, KY grew from $37,183 to $39,901 in the past year. This data is an estimate based upon 23,810 households in Bowling Green, KY . The chart below presents how household income is distributed in Bowling Green, KY in comparison to the revenue allocation amid households nationally.
Property Value
According to data from last year, the average property value in Bowling Green, KY shifted from $143,500 to $145,500 throughout the year. The subsequent graph indicates the share of properties in the given price range in Bowling Green, KY in comparison to the median property value in the same price segment across the country. According to the data, the greatest share of Bowling Green, KY properties falls in the '$100,000 to $124,999' range, which is lower than the most significant median property across the country.
Rent vs. Own
Property Taxes
One of the most important aspects for property owners is the amount of property taxes. This graph shows distribution of property taxes in Bowling Green, KY compared to median property taxes around the country. The prevalent amount of property taxes in Bowling Green, KY equals $1150, which is less than the national average.