Brandon, FL, USA apartments for sale
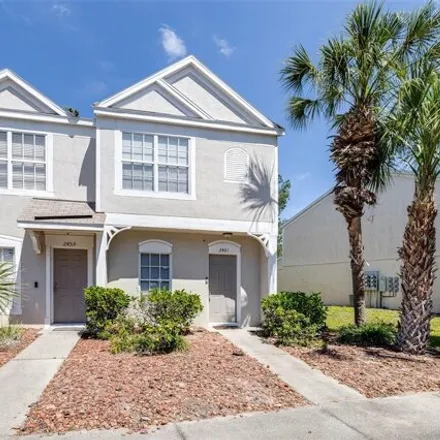
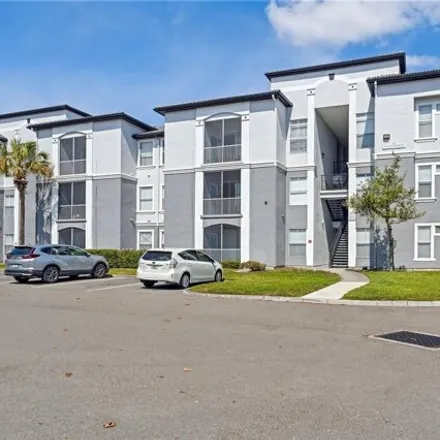
$229,999
$229,999
Available: Right Now
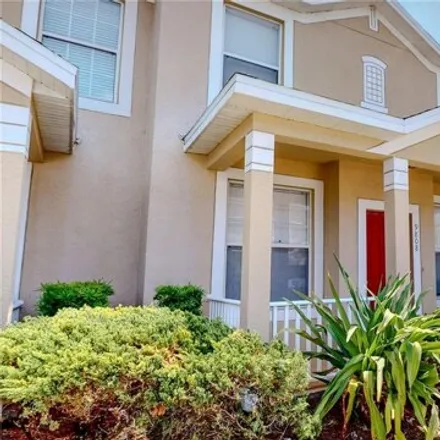
Here is your chance to own an affordable and well maintainedEND UNITTownhouse in the lovely gated community of Regency Key! 2 bed 2.5 baths with1, 184sq. ft. of heated living space makes it one of the larger units in the community! Fresh paint throug...
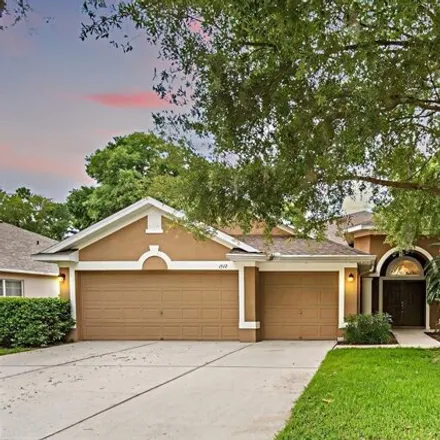
$510,000
$510,000
Available: Right Now
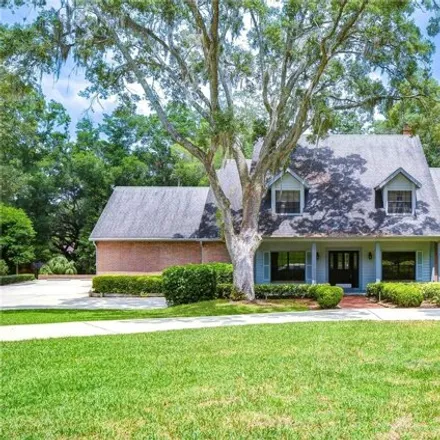
Discover Luxury Living in Diamond Hill: Your Dream Home Awaits!! Welcome to the gated golf community of Diamond Hill, where luxury meets tranquility. This expansive home offers an array of impressive features, including multiple living areas, an open...

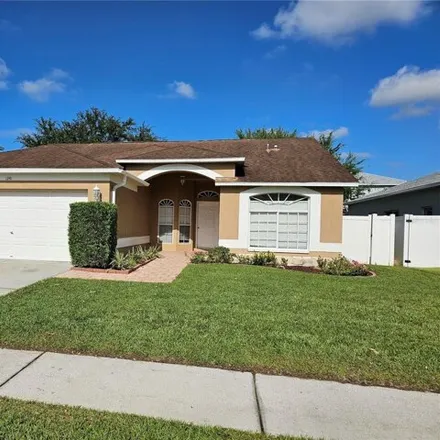
$359,900
$359,900
Available: Right Now
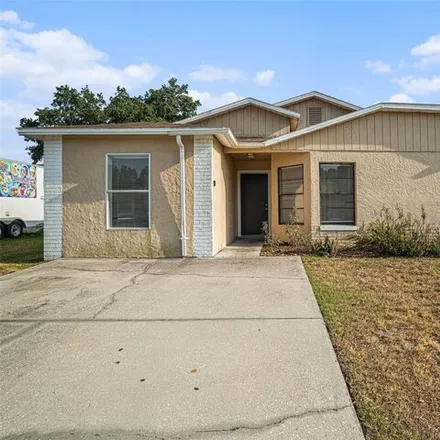
Completely remodeled home features a 3/2 split plan. Nice open area with vaulted ceilings in living room. Kitchen boosts brand new shaker cabinetry in the color white with Calacatta quartz countertops making it a desired place to entertain as it has ...

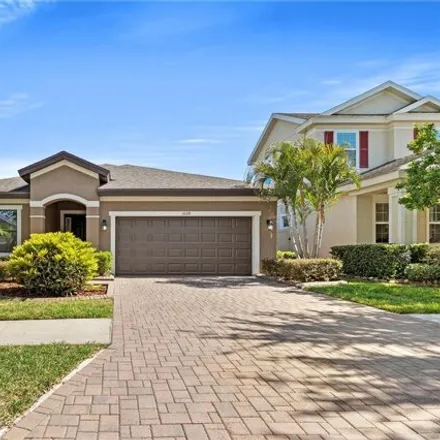
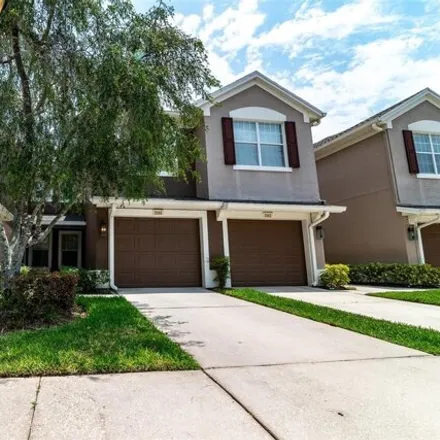
$419,900
$419,900
Available: Right Now
Welcome to your dream home in the heart of Brandon, FL! This beautifully renovated 3-bedroom (possibly 4!), 2-bathroom residence epitomizes modern comfort and convenience. With a brand-new roof installed in 2024, you can enjoy peace of mind and durab...
$379,000
$379,000
Available: Right Now
Ready to move in split bedrooms master to the left with brand new laminate flooring and sliding door out to the screened in Lanai. All the bedrooms have brand new laminate, living room, kitchen and all wet areas have tile throughout. Centrally locate...
$520,000
$520,000
Available: Right Now
Welcome to 1028 Alberro Avenue, located in the beautiful, gated community of La Collina. Built in 2015, this West Bay, Ibis Classical B model home is move-in ready and has of four bedrooms, two full baths, two car garage, and a covered, screened-in p...

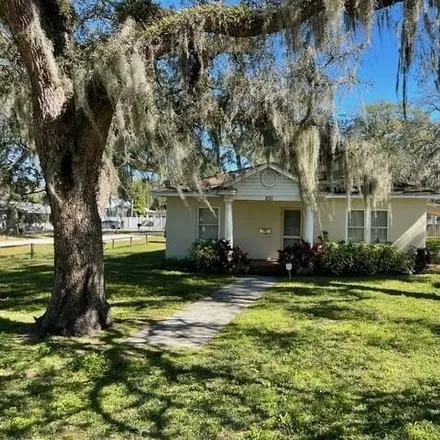
$355,000
$355,000
Available: Right Now
Discover an exceptional opportunity in the desirable Southwood Hills neighborhood, just moments from the Winthrop Town Center. This charming home features 3 bedrooms and 2 baths, enhanced by soaring vaulted ceilings that create a spacious atmosphere....
$170,000
$170,000
Available: Right Now
This investors special is nestled within the vibrant Allegro Palm community and offers prime opportunities for those seeking an income-generating property with a built-in tenant. Situated on the second floor, this corner unit exudes privacy and acces...
$314,900
$314,900
Available: Right Now
Welcome to this beautiful 3 bed 2 bath, one-story home located in the gated and maintenance-free community of Villa Serena! The AC and Hot water tank were replaced in (2022)! The refrigerator was replaced in (2022) and a new washer and dryer in (2021...

$400,000
$400,000
Available: Right Now
Affordable valrico tudor-style home tucked away in the quiet No hoa fee Lakemont neighborhood. This tri-level home with its One-of-a-kind floor plan features 4 beds, 3 baths, an oversized 2 car garage on 0.34 acreCORNERlot on a <...

$450,000
$450,000
Available: Right Now
Welcome to 2207 Summit View Drive, a spacious 4-bedroom, 2-bathroom home located in the desirable Buckhorn Springs neighborhood of Valrico, Florida. The home offers2, 182square feet of living space with an open floor plan that is perfect for modern l...
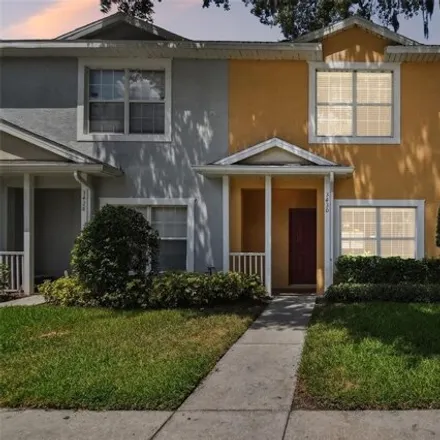
$239,000
$239,000
Available: Right Now
Charming and spacious, this oversized two-bedroom, three-bathroom townhome is situated in a highly desirable location. This FHA-approved corner unit is conveniently located next to the pool and includes three additional guest parking spots. The inter...

$355,000
$355,000
Available: Right Now
This stunning 2 bedroom 2 bath villa is nestled in a private gated community, with Pool, located in the desirable Bloomingdale area. This meticulous home is truly move in ready and very inviting. Well cared for, The kitchen features Newer LG Applianc...
$325,000
$325,000
Available: Right Now
Opportunity Knocks! Location, Location, Location! Just under an acre on the corner of Lithia Pinecrest Rd and Westbrook Ave, proving a TON of road frontage exposure to thousands of cars daily. Also, easy access to Bryan Rd via Westbrook Ave. and 2 bl...

$260,000
$260,000
Available: Right Now
LOOK at this Pristine osprey run townhome with tons of Gorgeous updates ! What an amazing opportunity to own your piece of paradise! This 3 bedroom, 2.5 bathroom townhome has been meticulously maintained. Stepping inside, you will see H...
$279,000
$279,000
Available: Right Now
Good opportunity one of the largest 3 bedroom 2.5 bath plus family room with a large screen lanai town home in the gated community of villages of bloomingdale, no back neighbors with a view of the pond. the community offers a club house, swimming ...
$750,000
$750,000
Available: Right Now
Are you seeking tranquility and space while remaining close to all amenities? Look no further. Nestled on 1.2 acres in the stunning Shady Hollow subdivision, where nature blends seamlessly with custom homes, this 4-bedroom, 3-bathroom residence offer...
$219,900
$219,900
Available: Right Now
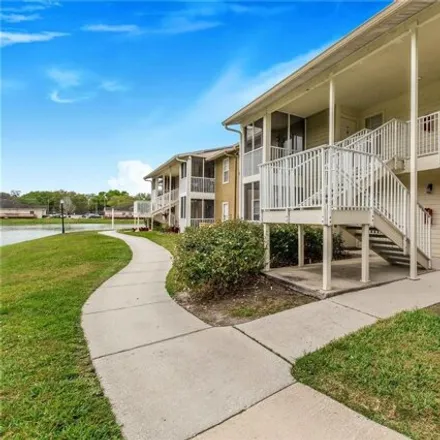
Beautiful second-floor apartment offering two bedrooms and two bathrooms. This unit showcases a stylishly designed kitchen, spacious open floor plan, and a screened-in patio with stunning views of a serene private lake. Residents can enjoy access to ...
$300,000
$300,000
Available: Right Now
Welcome to 1425 Vinetree Dr, a charming 3-bedroom, 2-bathroom residence in Brandon, FL! This cozy home offers1, 153square feet of comfortable living space, perfect for families or those seeking a peaceful retreat. With its well-designed layout, this ...
$949,900
$949,900
Available: Right Now
Discover the perfect blend of convenience and tranquility. Nestled amidst the community of Riverview, this property offers the best of both worlds: easy access to amenities and the serenity of 3.84 acres zoned ASC-1 for horses! This freshly painted (...

$430,000
$430,000
Available: Right Now
Back on market - buyer ' S loan fell through. here ' S your chance to see this Beautiful Brentwood Hills Pool Home. Huge oversized fenced-in lot. 4/2/2.This spacious home has a split bedroom floor plan so plenty of privacy. You w...

$610,000
$610,000
Available: Right Now
Looking for a country feel while still being close to everything? Then look no further! This charming 5 Bedroom, 3 Bath, 3 Car Garage home with screened pool is situated on a quiet cul-de-sac and features a1/2 ACRElot with plenty of room to spread ou...
Brandon
According to statistics, the population in Brandon, FL amounts to 113,124, which shows growth 3% compared to the previous year. The median age of the city’s residents is 37. The average household income is $59,054, shifting growth 2% from the past year, and the average property value in Brandon, FL growth 6% to $164,600 throughout the year.
| Population | 113,124 |
| Median Age | 36.9 |
| Poverty Rate | 12% |
| Household Income | $59,054 |
| Number Of Employees | 56,646 |
| Median Property Value | $164,600 |
What is the Average Price of Apartments for Sale in Brandon, FL?
| Month | Median Price |
|---|---|
| Jun 2024 |
$278,282
|
| May 2024 |
$258,928
|
| Apr 2024 |
$246,126
|
| Mar 2024 |
$246,126
|
| Feb 2024 |
$246,126
|
| Jan 2024 |
$246,126
|
| Month | Median Price |
|---|---|
| Jun 2024 |
$386,707
|
| May 2024 |
$397,622
|
| Apr 2024 |
$386,867
|
| Mar 2024 |
$441,821
|
| Feb 2024 |
$441,821
|
| Jan 2024 |
$441,821
|
Household Income
The average household income in Brandon, FL grew from $57,985 to $59,054 in the past year. This data is an estimate based upon 41,693 households in Brandon, FL . The chart below presents how household income is distributed in Brandon, FL in comparison to the revenue allocation amid households nationally.
Property Value
According to data from last year, the average property value in Brandon, FL shifted from $155,700 to $164,600 throughout the year. The subsequent graph indicates the share of properties in the given price range in Brandon, FL in comparison to the median property value in the same price segment across the country. According to the data, the greatest share of Brandon, FL properties falls in the '$150,000 to $174,999' range, which is lower than the most significant median property across the country.
Rent vs. Own
Property Taxes
One of the most important aspects for property owners is the amount of property taxes. This graph shows distribution of property taxes in Brandon, FL compared to median property taxes around the country. The prevalent amount of property taxes in Brandon, FL equals $1150, which is less than the national average.