Brea, CA, USA apartments for sale

$3,08M
$3,08M
Available: Right Now
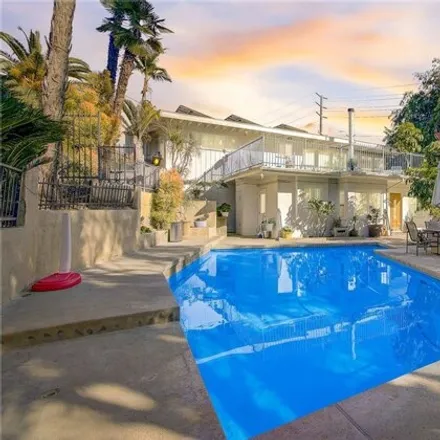
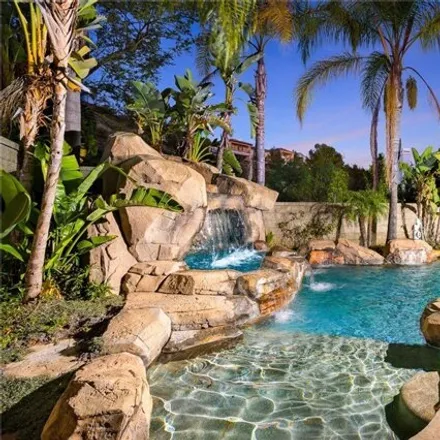
Rainforest landscape estate located in the hills of Carbon Canyon. This is 8010 square feet. Three floors located on a very private one bedroom lot. Canyon Beauty views from every room. Featuring 5 bedrooms and 6.5 bathrooms. Will enjoy the gourmet c...
$2M
$2M
Available: Right Now
Welcome to an unparalleled opportunity for development and luxury living in the serene enclave of La Habra Heights. Nestled on approximately 5 acres of sprawling land, this estate offers the epitome of seclusion and privacy, making it a dream retreat...
$179,900
$179,900
Available: Right Now
$1,35M
$1,35M
Available: Right Now
$2,88M
$2,88M
Available: Right Now
Discover the ultimate luxury living in Yorba Lindas premier neighborhood. This stunning residence was customized to offer the perfect blend of elegance and modernity, with exquisite details and spacious design. As you approach the property, you will ...
$1,89M
$1,89M
Available: Right Now
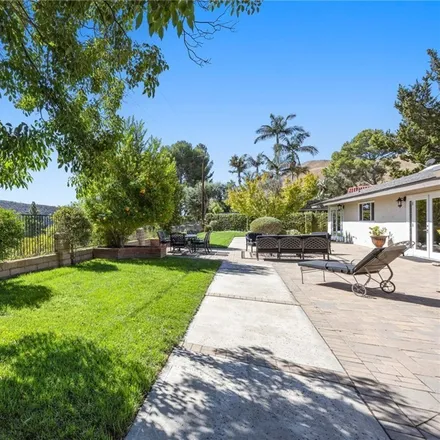
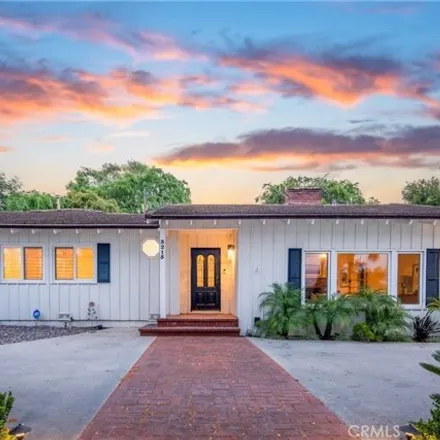
Welcome home to 3215 Arbol in San Juan Estates! A 13, 298Square Foot Lot and quietly located on an interior location, enter the horseshoe driveway to serene, single story living. This 3 bedroom, 3 bathroom home has been remodeled extensively with woo...
$299,999
$299,999
Available: Right Now
$2M
$2M
Available: Right Now
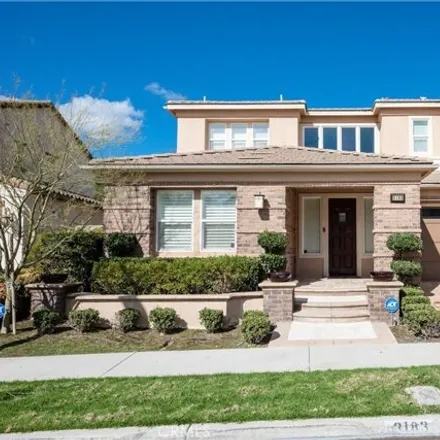
Gem of Blackstone Do not miss this desirable and Gorgeous Blackstone community home built in2012 ,This Spanish-style home features 5 Bedroom 4.5 bathrooms. It has a gorgeous curb appeal with the excellent and quiet neighborhoods.3 tandem cars direct ...
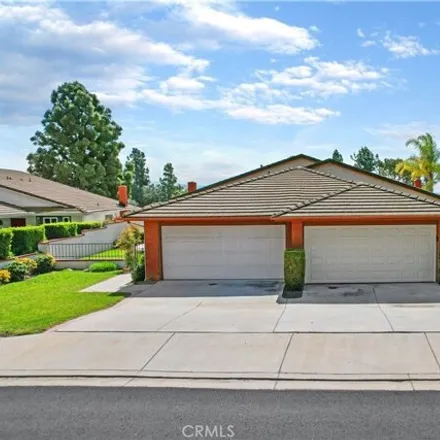
$1,08M
$1,08M
Available: Right Now
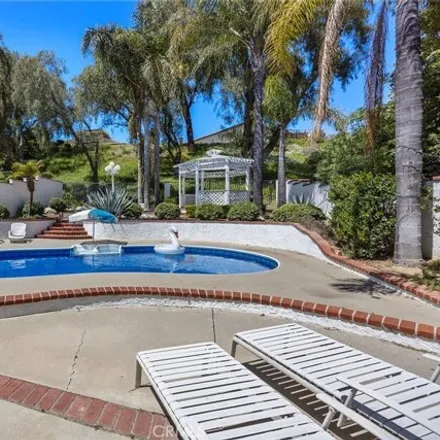
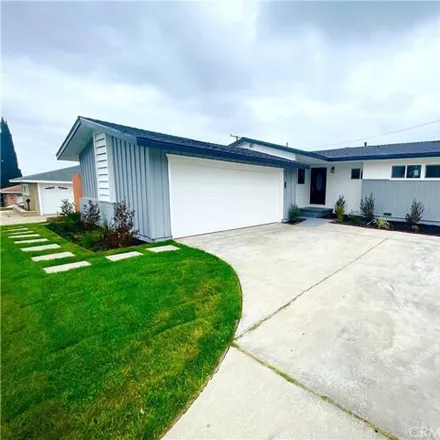
Situated on an oversized lot in a quiet, hilltop community is this 3 bedroom, 2 bath POOL home! Proudly nestled at the end of a cul-de-sac, this home excites from the moment you pull in the driveway. You are greeted with well-manicured landscaping, n...
$1,1M
$1,1M
Available: Right Now
This home is a must see ! This beautiful home is in the highly sought-after Park Paseo neighborhood! It features a bright and open floor plan with 4 bedrooms, 3 bathrooms with2, 327square feet of spacious living space on a large lot. WALKINGdi...
$1,13M
$1,13M
Available: Right Now
Nestled in the serene ambiance of Yorba Linda, this single-level home offers a true sanctuary for homeowners seeking tranquility and convenience. With no HOA or Mello Roos fees, this exceptional opportunity in a sought-after neighborhood promises a l...
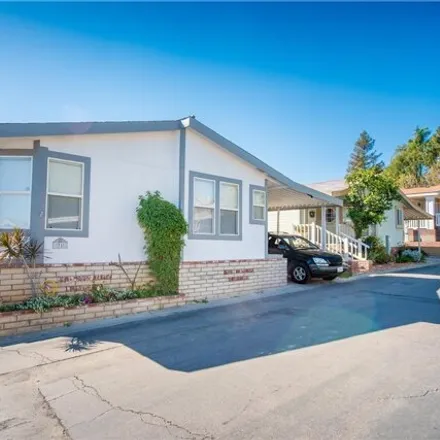
$178,000
$178,000
Available: Right Now
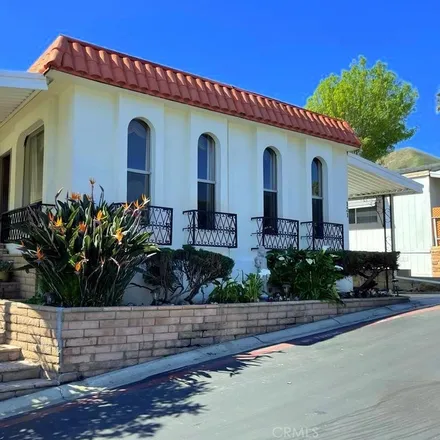
A Well-Maintained 2 beds, 2 baths with a large living room, kitchen, dining room, and family room. Freshly painted inside and out, new floor, some windows frames have been replaced, and kitchen counter walls. This home has a wonderful open feeling an...
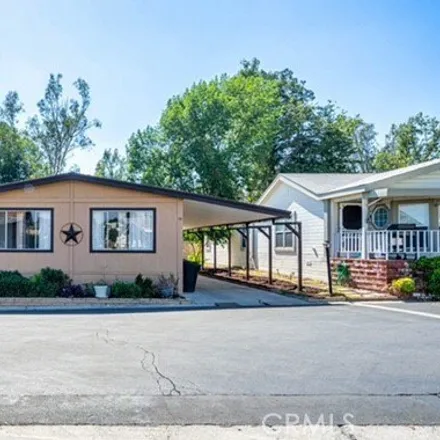
$235,000
$235,000
Available: Right Now
Nestled within the tranquil community of Crestmont Mobile Estates, this spacious manufactured home offers comfortable living in the heart of Brea, California. Boasting three bedrooms, two bathrooms, and a generous1, 680square feet of living space, th...
$1,25M
$1,25M
Available: Right Now
2 homes on a lot ! Fully remodeled brea home with a remodeled adu on a large lot ! This is a stunning, fully upgraded home with 2 beds/1 bath PLUS a 1 bed/1 bath fully remodeled ADU in the backyard with even more space for an additional...

$635,000
$635,000
Available: Right Now

$189,000
$189,000
Available: Right Now
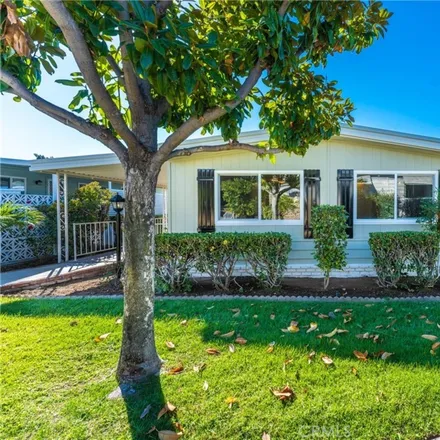
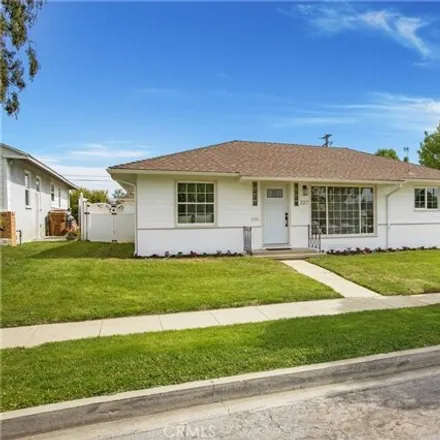
Impeccable Pride of Ownership! This exquisite 2-bedroom, 2-bathroom gem, nestled in the heart of Brea, is the perfect haven for your growing family. This home has been lovingly and meticulously maintained over the years. Upon entering, you're greeted...
$896,000
$896,000
Available: Right Now
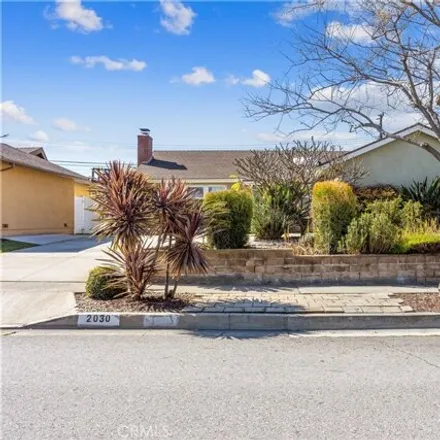
Nestled in the charming City of La Habra, 2030 Ramona Avenue is a cute 3-bedroom, 2-bathroom home offering the ideal blend of comfort and convenience. As you arrive you can see that this home has a LOT to offer! With ample parking and an attached two...

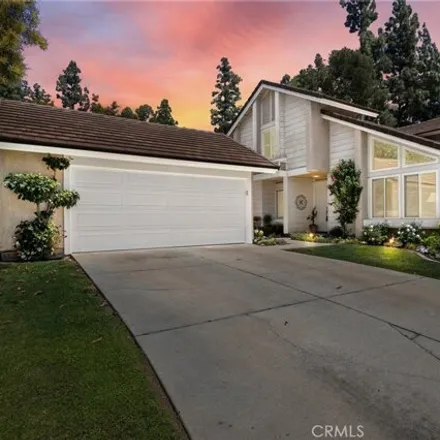
$1,55M
$1,55M
Available: Right Now
View view view ! This stunning Brea Hills residence features 4 bedrooms, 3 bathrooms, and approximately3, 090square feet of living space. Nestled in a serene, family-oriented neighborhood. Upon entering, you will be captivated by the elegant d...
$1,89M
$1,89M
Available: Right Now
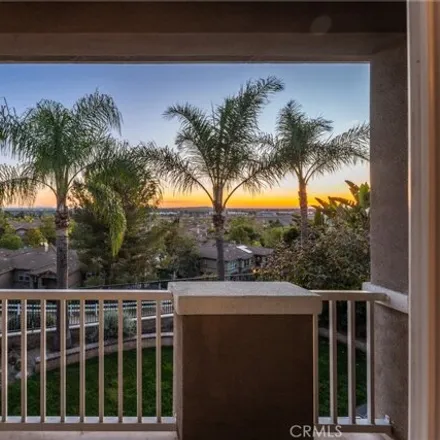
City light and Sunset view ! Stunning Shea Homes-built residence with 5 bedrooms (3 are suites)plus loft plus mainfloor bonus area on end of cul de sac home site in Yorba Linda's popular Vista Del Verde neighborhood centered around Blac...
$1,3M
$1,3M
Available: Right Now
Classic elegance meets modern style in this gorgeously updated home in the Vista Del Verde community of Augusta. This home features 3 bedrooms plus a downstairs office which could be used as a 4th bedroom and 3 full bathrooms. Upon entering the home ...
$869,000
$869,000
Available: Right Now
Newest Gem on the market has now arrived to the city of La Habra! Prepare to be astonished by this turnkey property featuring 3 Bedrooms, 2 Bathrooms that have been meticulously remodeled to provide you a true worry-free homeowner experience. Fall in...
$2,76M
$2,76M
Available: Right Now
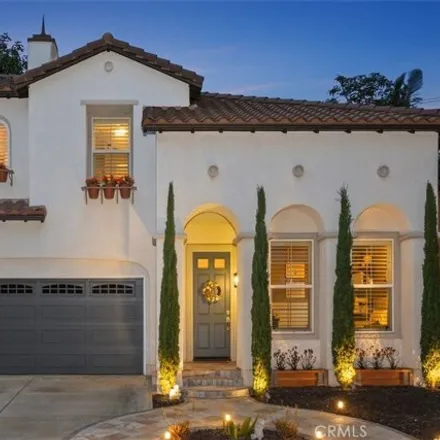
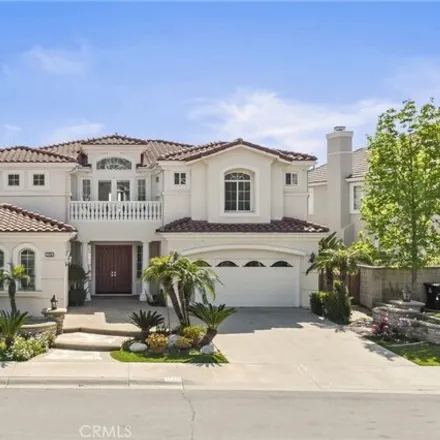
Welcome to luxury living at its finest in this exquisite Toll Brothers masterpiece! As you step through the grand entrance, you'll be greeted by a breathtaking round atrium foyer, setting the tone for elegance throughout. This home boasts an inviting...
Brea
According to statistics, the population in Brea, CA amounts to 41,921, which shows growth 1% compared to the previous year. The median age of the city’s residents is 38. The average household income is $90,214, shifting growth 5% from the past year, and the average property value in Brea, CA growth 5% to $610,700 throughout the year.
| Population | 41,921 |
| Median Age | 37.9 |
| Poverty Rate | 7% |
| Household Income | $90,214 |
| Number Of Employees | 21,530 |
| Median Property Value | $610,700 |
Household Income
The average household income in Brea, CA grew from $85,555 to $90,214 in the past year. This data is an estimate based upon 15,099 households in Brea, CA . The chart below presents how household income is distributed in Brea, CA in comparison to the revenue allocation amid households nationally.
Property Value
According to data from last year, the average property value in Brea, CA shifted from $579,600 to $610,700 throughout the year. The subsequent graph indicates the share of properties in the given price range in Brea, CA in comparison to the median property value in the same price segment across the country. According to the data, the greatest share of Brea, CA properties falls in the '$500,000 to $749,999' range, which is higher than the most significant median property across the country.
Rent vs. Own
Property Taxes
One of the most important aspects for property owners is the amount of property taxes. This graph shows distribution of property taxes in Brea, CA compared to median property taxes around the country. The prevalent amount of property taxes in Brea, CA equals $3000, which is less than the national average.