Buford, GA, USA apartments for sale
$635,000
$635,000
Available: Right Now
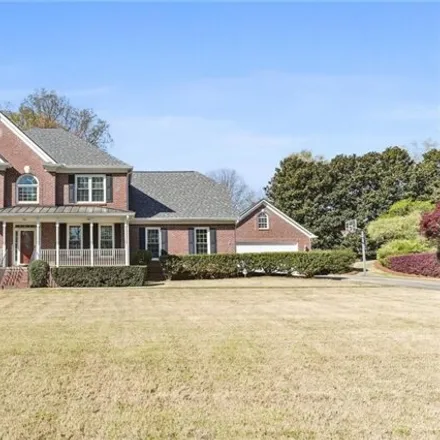
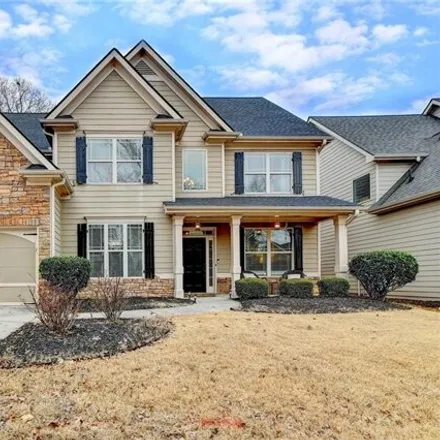
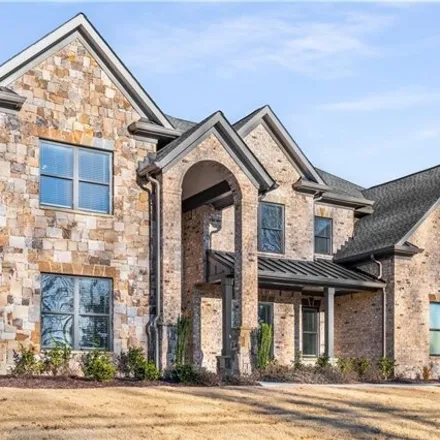
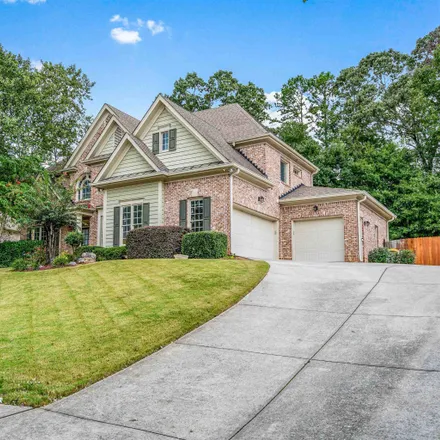
Welcome to your dream home in the heart of a vibrant community situated off Interstate 985! This stunning 5-bedroom, 3.5-bathroom residence offers the perfect blend of space, luxury, and convenience. Step inside to discover an inviting foyer with the...
$2,500
$2,500
Available: Right Now
Welcome to this incredible rental located in the sought after Sugar Hill / Buford area! This , 4-sided brick beauty home is a perfect rental with furnished option!! Inside, the well-designed layout flows seamlessly between living spaces, illuminated ...
$479,000
$479,000
Available: Right Now
Location ! Location ! Location ! In buford city schools ! Welcome to your new home and step into the heart of modern living in this thoughtfully designed home, where the open concept main level seamlessly merges the kitche...
$339,000
$339,000
Available: Right Now
Well maintained 4 bedroom 3 bath split foyer home located within 5 minutes to Lake Lanier access. Home is also located just a few miles from downtown Sugar Hill with access to restaurants, coffee shop, shopping, brewery, a theater and concert amphith...
$330,000
$330,000
Available: Right Now
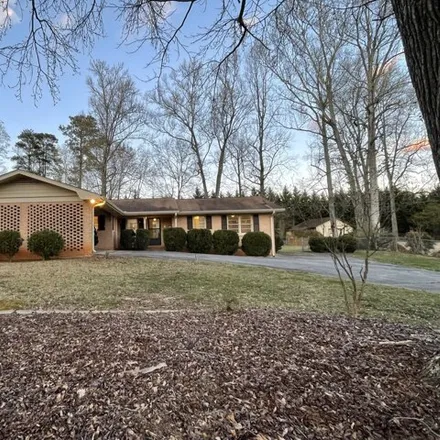
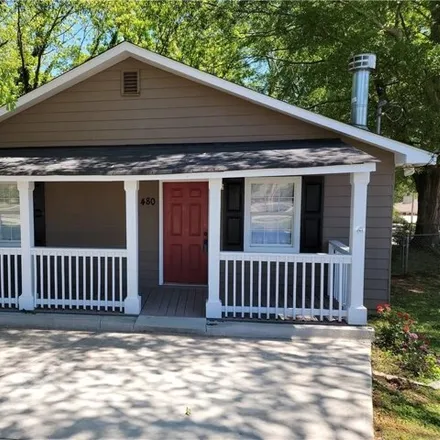
Buford City Schools! Don't miss the move-in ready 2 bed / 1 bath bungalow on a corner lot within walking distance to downtown Buford and all it has to offer. LVT flooring in the main living areas and new carpet in the bedrooms. The family room has a ...
$529,000
$529,000
Available: Right Now
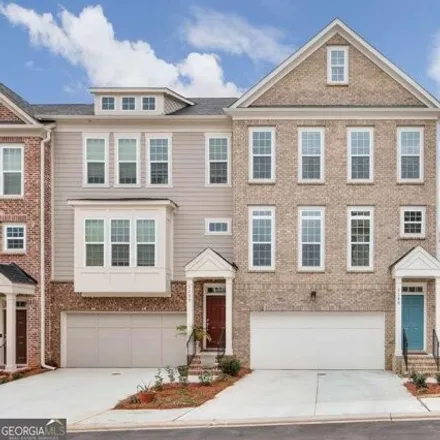
Like new, end unit townhouse in the coveted Northmark community! This CHuttonC floor plan by Pulte features over $100K in designer upgrades and a lot upgrade with rare open views out of the front AND back of the home. The main living area is o...
$868,000
$868,000
Available: Right Now
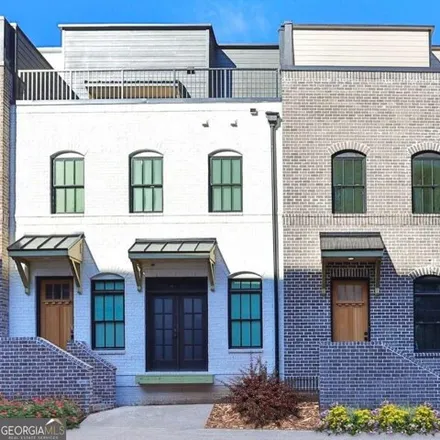
A bold blend of luxury and leisure, downtown Sugar Hill is one of the Metro Atlanta's new destinations for businesses, homebuyers and visitors alike. At the heart of it all, Skyview on Broad emulates the cityCOs progressive vibe and down-home sensibi...
$530,000
$530,000
Available: Right Now
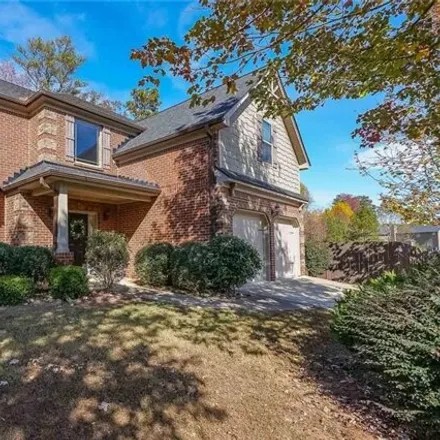
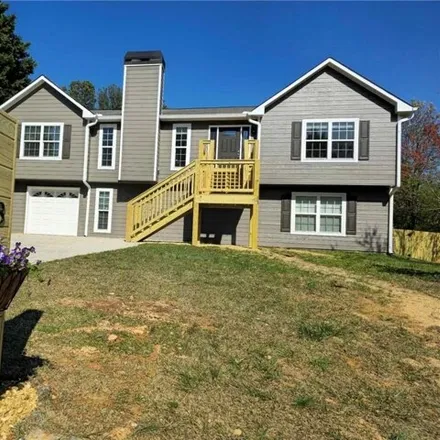
New Roofing! 4 BD/2.5 BABeautiful 2-Story Foyer, 2 pc Crown Molding and Shadows Boxes with Chair rail thru-out main level including Arched Entryways, Formal Living and Coffered Ceiling in Formal Dining, Bronze lighting, door hardware and plumbing fix...
$505,000
$505,000
Available: Right Now
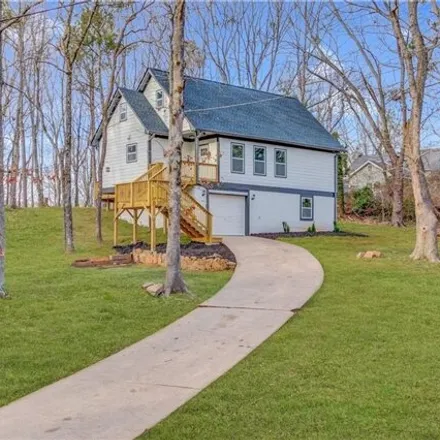
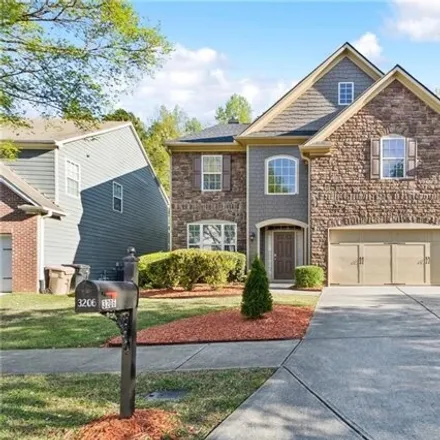
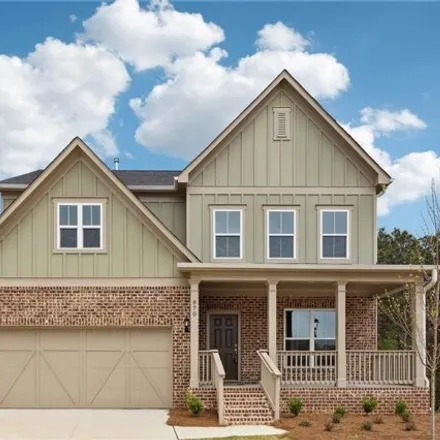
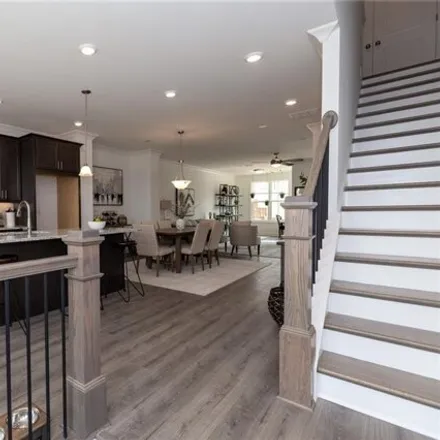
Spacious 4-Bedroom Home with Loft in Buford, GA | Swim Tennis Community Description: Discover this charming 4-bedroom, 3-bathroom home located at 3206 Montauk Hill Dr in Buford, GA 30519.Featuring a bedroom on the main level and a versatile loft area...
$325,000
$325,000
Available: Right Now
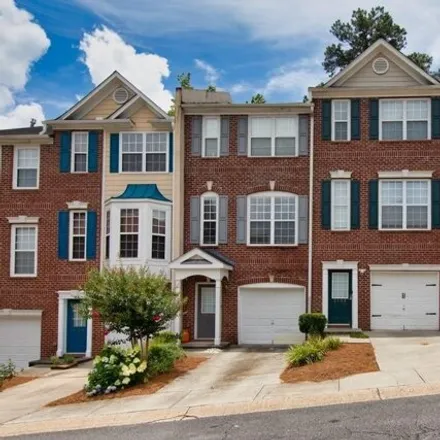
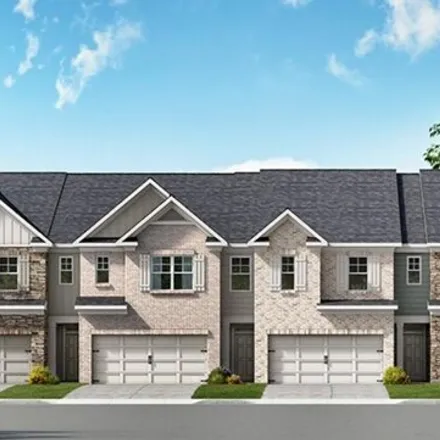
Stunning Townhouse with 2 Bedrooms, 2.5 Baths, and Bonus Room This impeccably maintained townhouse is ideally situated right across from the Mall of Georgia and provides the perfect blend of modern amenities and convenience. With 2 ample bedrooms, 2....
$860,000
$860,000
Available: Right Now
Beautiful and private home on 3.79 Acre with a lot of updates. Brand new hardwood floors throughout the first and second floors, just minutes from mall of GA and shopping and very close to hwy 85 and 985. Finished basement with full kitchen and addit...
$1,19M
$1,19M
Available: Right Now
Welcome home down the long winding drive-way to this hard to find ranch on full finished basement on 4.5 private acres in City of Buford School district!! This very rare private wooded oasis with well-built remodeled custom home features 6 bedrooms/3...
$550,000
$550,000
Available: Right Now
This stunning two-story home boasts 5 bedrooms, 3 bathrooms, and a 2-car garage. Step inside to experience a luxurious open floor plan with a spacious living room adorned with coffered ceilings and a cozy fireplace, perfect for gatherings with loved ...
$639,900
$639,900
Available: Right Now
Brand New Move in ready home which is hard to find at near by Suwanee technology area, with warranties in Northmark subdivision. Excellent location ! 2.9 miles drive to Suwanee Town Center, ALL shopping, Restaurants , Hospital and Entertainmen...
$509,900
$509,900
Available: Right Now
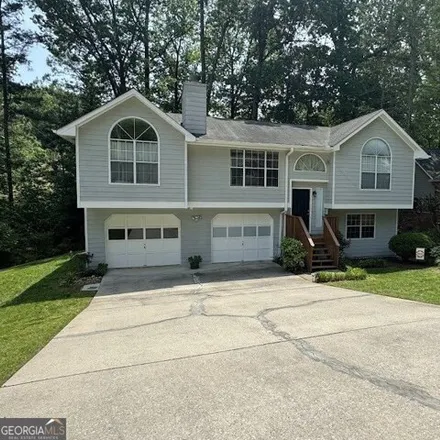
Beautiful 5 bed/ 3 bath home in a quiet Buford subdivision. This home has been completely remodeled. The curb appeal starts with the new front porch, new exterior paint, and new front door with sidelights entering into the open living room, dining ar...
$1,27M
$1,27M
Available: Right Now
New Construction Estate Homes on beautiful, private, large estate lots in the City of Buford School District! $20, 000to use for closing cost, buy down rate or upgrades with our lender, Lincoln Capital Advisors AND free REFI when you're ready. These ...
$2,5M
$2,5M
Available: Right Now
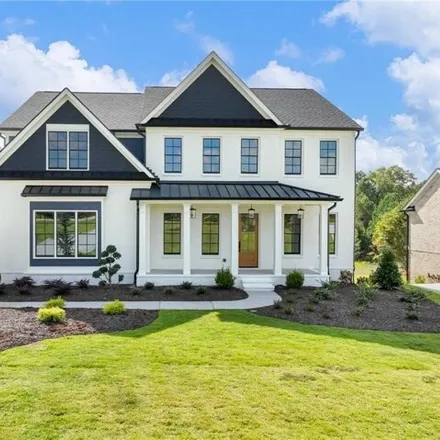
Exquisite 6-bed, 5.5-bath luxury home in a prestigious neighborhood. Boasting7, 400sqft on a.96-acre lot with no HOA. This gem features two master suites, a 5-car garage with 2 lifters, a 36x18 heated saltwater pool with a spa, and a fully equipped b...
$407,990
$407,990
Available: Right Now
Greyton Springs Place, Buford's Newest Townhome Community Conveniently located 1 mile from the Mall of Georgia featuring great shopping and dining; only 1.5 miles from 185 and 2.5 miles from1-985. Ashort drive to Top Golf, Andretti's and Northside's ...
$504,650
$504,650
Available: Right Now
Incredible Views in Amazing Location. Gated Community Garwood Plan only 5 in units in the whole community with this plan!!! Pick yours and have a unique home Elevate your life in 2023 with a new home by The Providence Group and$5, 000towards closing ...
$1,7M
$1,7M
Available: Right Now
This to be built, luxurious custom-built home awaits on nearly 2 acres of private land, embraced by a fenced and gated oasis with no HOA restrictions. The attention to detail is evident throughout this exquisite home, which boasts an expansive main l...
$884,900
$884,900
Available: Right Now
$999,900
$999,900
Available: Right Now
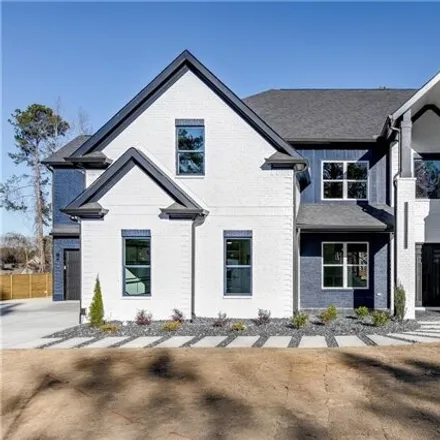
Buford city schools !! Another well designed, well-built traditional style home coming soon to buford ! Take a drive and see what this experienced builder is doing in Buford. This Large home is 1 of 9 coming to Thunder Road from this Bu...
Buford
According to statistics, the population in Buford, GA amounts to 14,662, which shows growth 5% compared to the previous year. The median age of the city’s residents is 36. The average household income is $48,772, shifting decline -5% from the past year, and the average property value in Buford, GA growth 12% to $182,500 throughout the year.
| Population | 14,662 |
| Median Age | 36.2 |
| Poverty Rate | 17% |
| Household Income | $48,772 |
| Number Of Employees | 6,858 |
| Median Property Value | $182,500 |
What is the Average Price of Apartments for Sale in Buford, GA?
| Month | Median Price |
|---|---|
| Apr 2024 |
$524,193
|
| Mar 2024 |
$524,193
|
| Feb 2024 |
$524,193
|
| Jan 2024 |
$524,193
|
| Dec 2023 |
$510,308
|
| Nov 2023 |
$560,225
|
Household Income
The average household income in Buford, GA declined from $51,463 to $48,772 in the past year. This data is an estimate based upon 4,708 households in Buford, GA . The chart below presents how household income is distributed in Buford, GA in comparison to the revenue allocation amid households nationally.
Property Value
According to data from last year, the average property value in Buford, GA shifted from $162,800 to $182,500 throughout the year. The subsequent graph indicates the share of properties in the given price range in Buford, GA in comparison to the median property value in the same price segment across the country. According to the data, the greatest share of Buford, GA properties falls in the '$250,000 to $299,999' range, which is lower than the most significant median property across the country.
Rent vs. Own
Property Taxes
One of the most important aspects for property owners is the amount of property taxes. This graph shows distribution of property taxes in Buford, GA compared to median property taxes around the country. The prevalent amount of property taxes in Buford, GA equals $800, which is less than the national average.