Bull Valley, IL, USA apartments for sale
$789,900
$789,900
Available: Right Now
Overlook the 13th Signature hole at Bull Valley Golf Club Every single day ! Beautiful Breckenridge built home with forever views down the tee box, through the fairway and over the pond. This is a TRUE First floor Primary Suite to die for with...

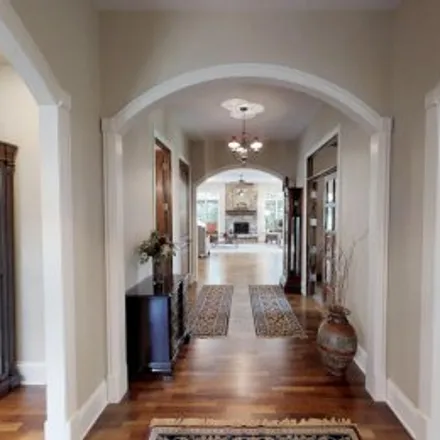
$695,000
$695,000
Available: Right Now
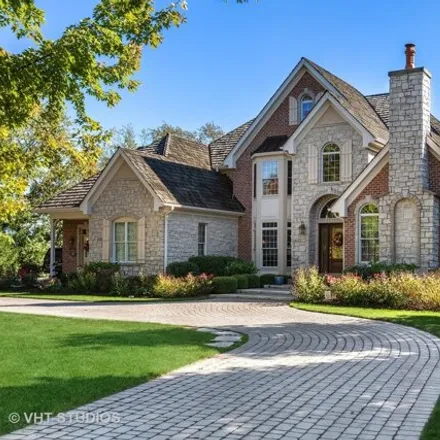
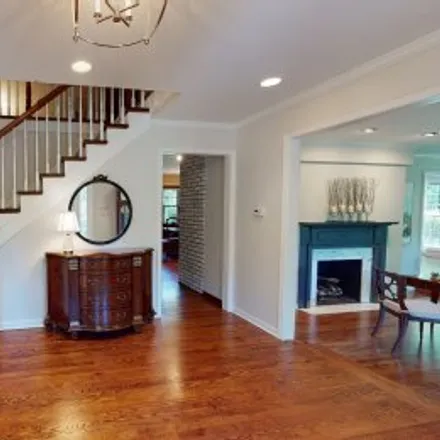
Move in ready and then some! Owners hate to leave but a new job makes it necessary. Three fireplaces. New hardwood floors throughout, with new carpeting in the bedrooms. Interior has been freshly painted. Kitchen is a chef's dream with stainless stee...
$1,2M
$1,2M
Available: Right Now
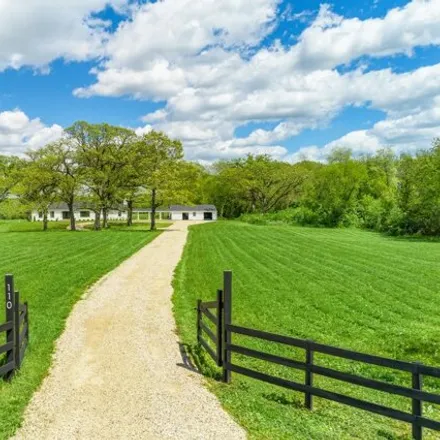
Welcome to The Ranch at 110 North Fleming Road in Bull Valley. This stunning farmhouse sits on 40 gorgeous acres of rolling hills. The completely renovated home was brought back to life from the ground up in 2022. As you step through the front glass ...

$839,000
$839,000
Available: Right Now
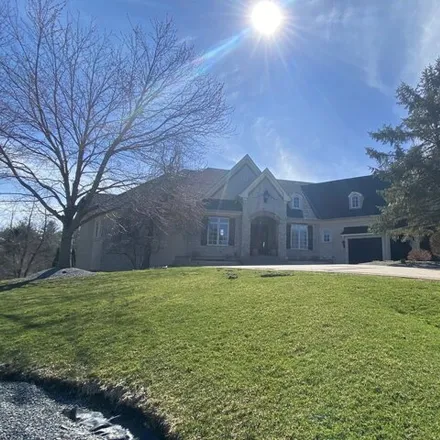
High and Mighty - this home sits on a plateau, with Golf Course Views of the 10th Fairway of the Bull Valley Golf Course. This expansive home features a FIRST Floor Primary Bedroom, a palatial GREAT Room and expansiveOUTDOORliving space, as well. The...
$1,95M
$1,95M
Available: Right Now
Incredible LANCO built custom RANCH home located on beautiful Galloway Drive in Bull Valley Golf Club. Over 3600 square feet on the first level plus that again in the full finished walkout lower level. This home overlooks the 1st tee box, has an ingr...

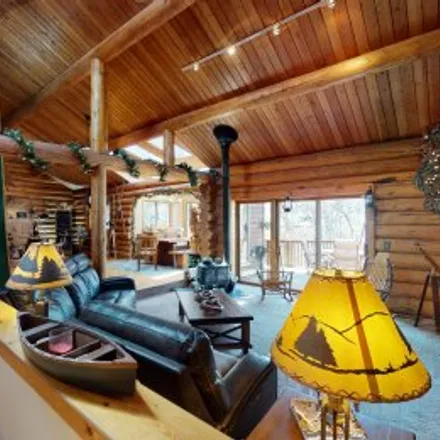
$899,000
$899,000
Available: Right Now
Experience retreat living all year round in this one-of-a-kind home that blends luxury, craftsmanship, and natural beauty! This majestic country estate is nestled in the woods of Bull Valley on 8.86 wooded acres, offering expansive views of the surro...

$450,000
$450,000
Available: Right Now
This is a hard to find spacious ranch style home on almost an acre of land in desirable Woodcreek subdivision... This beautiful ranch home sits far away from the street with much privacy on the deck...The interior of the home features cathedral ceili...

$389,900
$389,900
Available: Right Now
Stunning Turnberry model in the desirable Ponds of Bull Valley. Great location backing to open space and park. This home has many nice updates and upgrades! As you enter into the living room you will immediately feel at home with the volume ceilings ...

$459,900
$459,900
Available: Right Now
Welcome Home to this beautiful Ultima model home. Located in the Preserves of Legend Lakes this home sits on a 1/2-acre lot backing up to prairie preserves. Sit at your stamped concrete patio while viewing gorgeous sunsets. Enter the expansive 2 stor...

$589,900
$589,900
Available: Right Now
Country home on 3+ acres. Horses allowed and bridle path at the back of the property. Not your typical Cape Cod. 2nd Story Bump Out makes the home bigger than most. 2-Story foyer, living room with a wood burning stove insert within the fireplace (can...

$1,05M
$1,05M
Available: Right Now
Picturesque 8+ acre homesite consisting of 3 parcels. The home offers 2.91 acres with lots on either side comprising 2.3 and 2.81 acres. Exceptional Like-new construction custom Bull Valley equestrianESTATEnestled within the serene Orchard Val...

$775,000
$775,000
Available: Right Now
Nestled within the prestigious Bull Valley Golf Club, this luxurious7, 600square foot home with 4 large bedrooms and 4.5 bathrooms, epitomizes refined living. From the moment you enter, elegance greets you at every turn and includes a custom cherry s...

$565,000
$565,000
Available: Right Now
Welcome to your own personal treehouse! You have to walk through this incredible custom home to truly experience how much it has to offer! 3, 893 sqft in the 1st and 2nd floor open floor plan, plus an additional1, 800sqft finished in the walkout lowe...
$549,900
$549,900
Available: Right Now
Experience the perfect blend of luxury and nature at 7312 Stirlingshire Ct. Nestled in the serene Bull Valley area, this exquisite home boasts a prime lot with breathtaking views of the surrounding conservation district, poised for those who dream of...

$475,000
$475,000
Available: Right Now
Welcome home to this beautiful 4 bed / 2.5 bath home with a partially finished basement, a gorgeous sun room, and a three-car garage! Perfect location in a quiet neighborhood, on nearly three quarters of an acre! A cozy front porch welcomes yo...
$684,580
$684,580
Available: Right Now
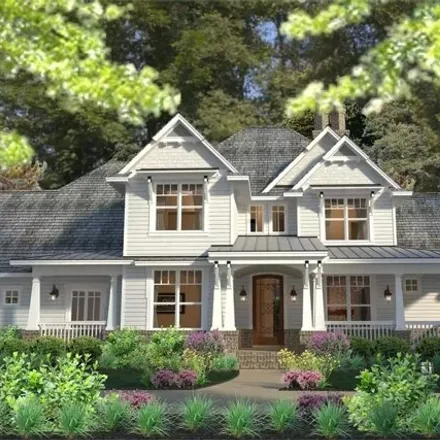
Exciting opportunity to build your dream home in lovely Bull Valley Golf Club. This gorgeous home is proposed to be built by Walsh Design and Build, LLC, and is designed by The House Designers. This amazing home features a main level Master Suite, Gr...
$649,900
$649,900
Available: Right Now
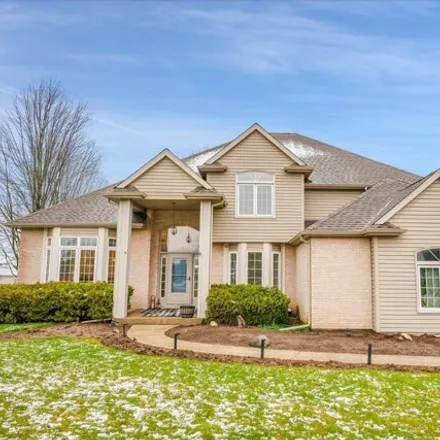
This exquisite 4-bedroom, 3-bathroom home offers modern luxury and spacious living on a sprawling 1-acre lot. As you step inside, you're welcomed by an abundance of natural light filtering through the newer Pella windows, illuminating the stylish int...
$699,000
$699,000
Available: Right Now
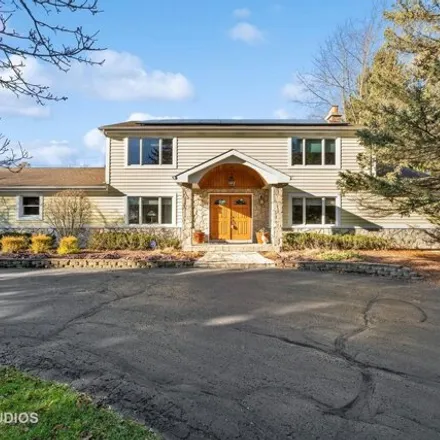
This Custom 4 Bedroom 3 1/2 Bath Home With Its Large Room Sizes and Great Floorplan Sits Nestled In A Peaceful Wooded Setting On 4.3 Acres. This lovely home is designed for family living and entertaining. Upon entering you will be greeted by hardwood...

$729,900
$729,900
Available: Right Now
Magnificent 5 Br, 3.5 Ba, 2 Story open concept home on meticulously manicured 1-acre property. Large open spaces for gatherings with natural light flowing into the interior spaces. 3 Car heated garage with ample storage cabinets. Brazilian Cherry flo...
$1,25M
$1,25M
Available: Right Now
Apartment for sale in/on/near 10710 Deerpath Road, Woodstock Country Club Hills, Woodstock. The price for this apartment is $1,250,000. This 7217-square-feet 5 bedroom apartment features 7 bathroom. Contact the agent to schedule an open house...
$799,000
$799,000
Available: Right Now
Apartment for sale in/on/near 1420 West Longwood Drive, Bull Valley Golf Club, Bull Valley. The price for this apartment is $799,000. This 4600-square-feet 4 bedroom apartment features 5 bathroom. Contact the agent to schedule an open house....
$480,000
$480,000
Available: Right Now
Apartment for sale in/on/near 6327 Ojibwa Lane, Lake Dawnwood, Mchenry. The price for this apartment is $480,000. This 4484-square-feet 4 bedroom apartment features 4 bathroom. Contact the agent to schedule an open house....
Bull Valley
According to statistics, the population in Bull Valley, IL amounts to 1,483, which shows growth 22% compared to the previous year. The median age of the city’s residents is 50. The average household income is $120,313, shifting decline -2% from the past year, and the average property value in Bull Valley, IL growth 4% to $404,700 throughout the year.
| Population | 1,483 |
| Median Age | 49.8 |
| Poverty Rate | 1% |
| Household Income | $120,313 |
| Number Of Employees | 687 |
| Median Property Value | $404,700 |
Household Income
The average household income in Bull Valley, IL declined from $122,708 to $120,313 in the past year. This data is an estimate based upon 543 households in Bull Valley, IL . The chart below presents how household income is distributed in Bull Valley, IL in comparison to the revenue allocation amid households nationally.
Property Value
According to data from last year, the average property value in Bull Valley, IL shifted from $387,500 to $404,700 throughout the year. The subsequent graph indicates the share of properties in the given price range in Bull Valley, IL in comparison to the median property value in the same price segment across the country. According to the data, the greatest share of Bull Valley, IL properties falls in the '$300,000 to $399,999' range, which is higher than the most significant median property across the country.
Rent vs. Own
Property Taxes
One of the most important aspects for property owners is the amount of property taxes. This graph shows distribution of property taxes in Bull Valley, IL compared to median property taxes around the country. The prevalent amount of property taxes in Bull Valley, IL equals $3000, which is less than the national average.