Calabasas, CA, USA apartments for sale
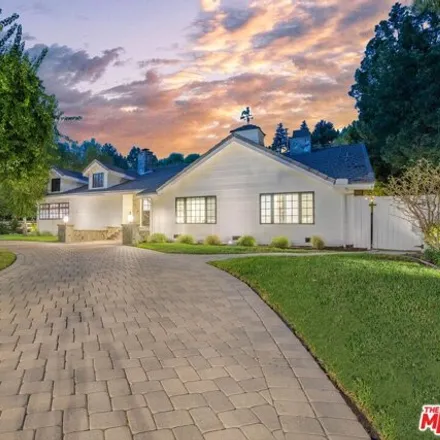
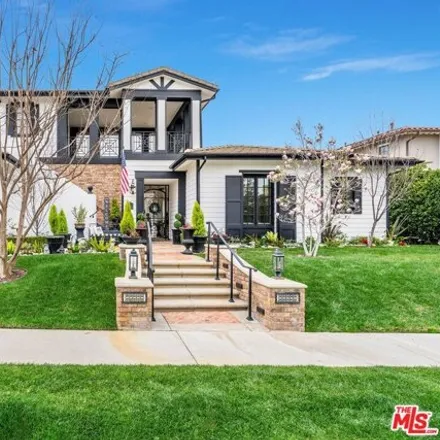
$5,6M
$5,6M
Available: Right Now
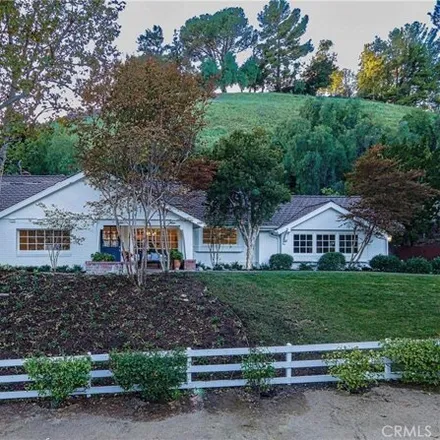
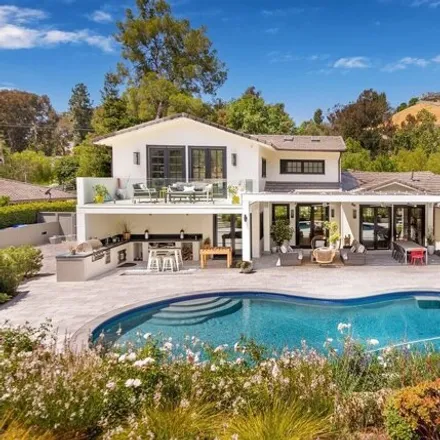
Enchanting Hidden Hills Modern Farmhouse. Sited on nearly 1.5 acre premiere corner lot, this home radiates elegant charm with its circular driveway, sprawling lawns and mature landscape. Double door entry welcomes you to a beautifully scaled open flo...
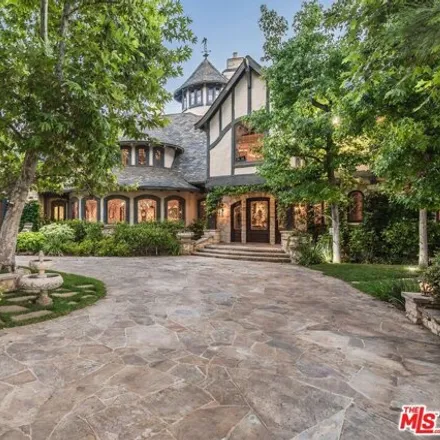
$7,25M
$7,25M
Available: Right Now
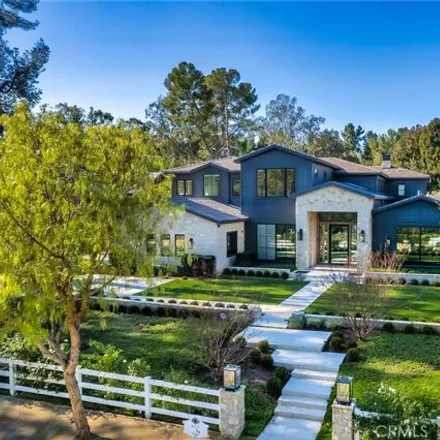
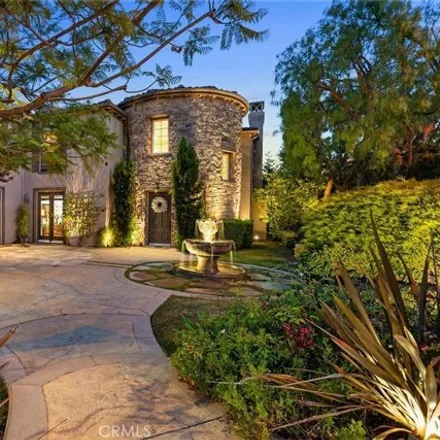
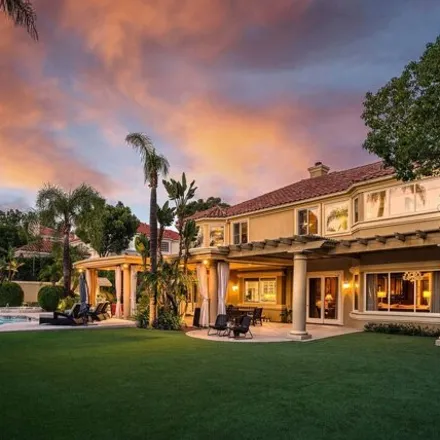
Stunning French-inspired Chateau situated on 10+ acres of serene park like grounds within the exclusive gated Calabasas enclave of Cold Creek Estates. Enjoy breathtaking and unobstructed canyon views from this remarkable residence, surrounded by the ...
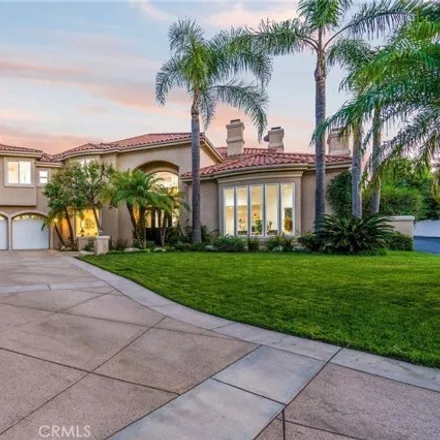
$4,7M
$4,7M
Available: Right Now
Located within the highly desirable, guard-gated Mountain Park estates, at the end of Mountain Park Dr., lies this substantial, 2021 remodeled and impeccably designed masterpiece. The home is perfectly situated on a flat, 45, 000square-foot lot, with...

$2,9M
$2,9M
Available: Right Now
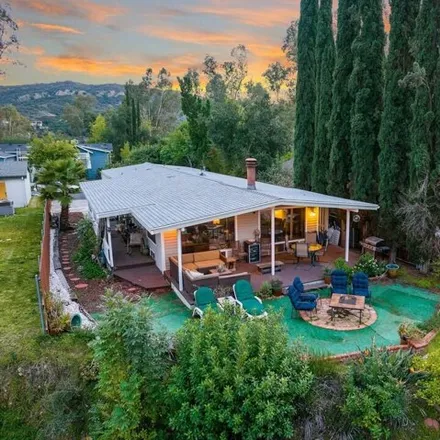
Located just south of Ventura Blvd and nestled among lush trees with breathtaking mountain views, this architecturally unique property offers a rare opportunity to own a lucrative income property comprising 7 units: a main 3-bedroom, 3.5-bathroom hom...
$8,9M
$8,9M
Available: Right Now
This beautifully remodeled and nicely upgraded Cape Cod Estate is nestled on a very private 1.3 acre lot, surrounded by mature fruit and shade trees and sited on a prime double cul-de-sac. Highlights include a gorgeous, newer gourmet kitchen with sta...

$549,000
$549,000
Available: Right Now
Fresh on the market! Nestled in the quiet, prime location of Las Virgenes Park Townhomes, this charming and sunny 1 bedroom, 1 bathroom townhome is a corner unit offering added privacy. The cozy living room boasts vaulted ceilings, recessed lighting,...
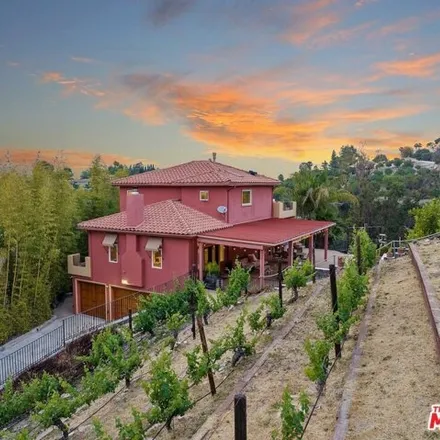
$2,25M
$2,25M
Available: Right Now
Don't miss the opportunity to own this one of a kind gated Tuscan style estate with an impressive producing vineyard, on a quiet street offering serene views and incredible privacy. Perched on a large29, 000+ sqft lot, this gorgeous 5 bedroom, 5 bath...

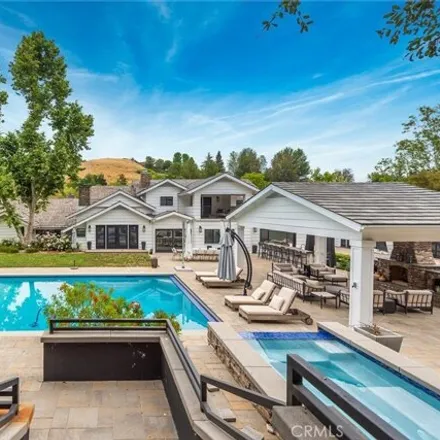
$9,5M
$9,5M
Available: Right Now
This beautifully upgraded, traditional-style estate spans approximately9, 376square feet of luxury living and is nestled on over an acre of flat land. Nicely remodeled throughout, highlights include a superb chef's kitchen featuring two large islands...

$1,5M
$1,5M
Available: Right Now
Welcome home to this beautiful single story house located south of ventura blvd in a quiet neighborhood. this open floor plan house featues 4 bedrooms, 3 bathrooms, high vaulted wood beam ceiling living room, formal dining room, huge chef ' ...
$5,15M
$5,15M
Available: Right Now
An extremely rare opportunity! SINGLE level property with an ADU guest house suite on the second level built in. In a community with majority of two level homes, a highly sought after single level rarely appears and this level of luxury is exceptiona...

$3,3M
$3,3M
Available: Right Now
Nestled in the prestigious Westridge guard-gated community in Calabasas, this exceptional single-family residence seamlessly harmonizes opulence with tranquility. Spanning an impressive5, 000square feet across two levels, this home offers an unparall...

$3,75M
$3,75M
Available: Right Now
Located within the prestigious gated community of Clairidge Estates, awaits this highly sought after single story 5 bed, 4.5 bath, 5, 313sq ft luxury hacienda on a generous22, 045square foot pad. Surrounded by breathtaking canyon and mountain views i...
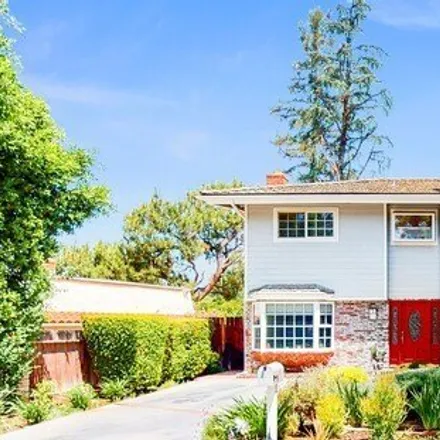
$1,55M
$1,55M
Available: Right Now
Beautiful and lovingly cared for single-family home located in a highly desirable neighborhood off of Calabash Street with access to some of the best charter schools (primary and secondary) in the region. Convenient location is walking distance to Ca...
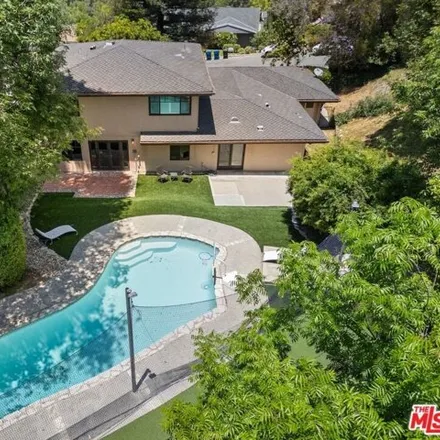
$2,15M
$2,15M
Available: Right Now
Welcome to your updated traditional dream home! This charming abode boasts timeless elegance and modern conveniences, making it the perfect blend of classic and contemporary living. With 5 bedrooms, 3.5 bathrooms, plus a dedicated office space, there...
$4,59M
$4,59M
Available: Right Now
Nestled within the exclusive equestrian gated community of Hidden Hills, you'll find this exquisite remodeled traditional home with four bedrooms and three bathrooms. This home showcases beautiful craftsmanship and a timeless warm elegance. As you st...
$1,6M
$1,6M
Available: Right Now
Nestled in the highly coveted south of the boulevard neighborhood of Woodland Hills, with a panoramic view from Topanga to the Warner Center, this tranquil architect-designed-and-built retreat offers breathtaking views and close proximity to highly r...

$1,45M
$1,45M
Available: Right Now
Topanga Skyline Studio | Live/Work Loft, 1957.Own a piece of history in this fabled canyon recording venue, where a long list of music legends has performed over the years, including Bob Dylan, Neil Young, Robert Plant, and Sting. According to local ...
$23,9M
$23,9M
Available: Right Now
This beautiful custom estate is nestled on a lushly landscaped and truly gorgeous 1.5 acre lot. The superb open floor plan is flooded with natural light and is highlighted by excellent quality finishes throughout. Amenities include a stellar chef's k...
$3,55M
$3,55M
Available: Right Now
Welcome to 26938 Alsace Dr., a stunning residence in the prestigious guard-gated community of Mont Calabasas, meticulously updated and maintained to offer the ultimate in luxury living. This beautiful home boasts an impressive array of upgrades and r...
$5,28M
$5,28M
Available: Right Now
Nestled in the highly coveted, equestrian, guard gated community of Hidden Hills discover this newly renovated, unique blend of timeless farmhouse fused with the seamless sophistication and elegance of contemporary design. An open floor plan features...
$598,000
$598,000
Available: Right Now
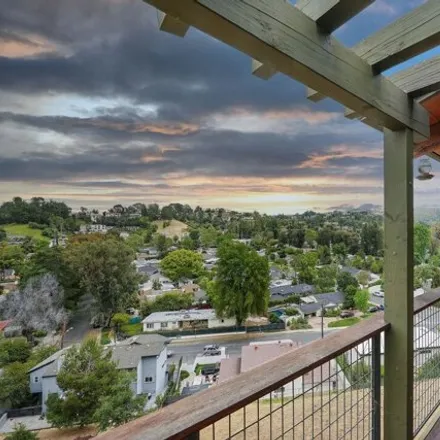
Escape to an idyllic home with the most jaw-dropping views in the park. This peaceful retreat in the exclusive neighborhood of Calabasas Village is just minutes from the area's best shopping, dining and schools - but you'd never know it from the soar...
$4M
$4M
Available: Right Now
Sought after plan 10 offers luxury and a coveted floor plan in the prestigious Mountain View Estates of Calabasas. A formal entry welcomes you to experience this impressive home featuring a beautiful formal living room with coffered ceilings and a fi...
Calabasas
According to statistics, the population in Calabasas, CA amounts to 24,169, which shows decline 0% compared to the previous year. The median age of the city’s residents is 43. The average household income is $114,143, shifting growth 3% from the past year, and the average property value in Calabasas, CA growth 5% to $976,300 throughout the year.
| Population | 24,169 |
| Median Age | 43.4 |
| Poverty Rate | 8% |
| Household Income | $114,143 |
| Number Of Employees | 11,802 |
| Median Property Value | $976,300 |
What is the Average Price of Apartments for Sale in Calabasas, CA?
| Month | Median Price |
|---|---|
| Jun 2024 |
$1,283,285
|
| May 2024 |
$1,507,995
|
| Apr 2024 |
$1,370,134
|
| Mar 2024 |
$1,370,134
|
| Feb 2024 |
$1,370,134
|
| Jan 2024 |
$1,370,134
|
| Month | Median Price |
|---|---|
| Jun 2024 |
$1,763,499
|
| May 2024 |
$1,773,679
|
| Apr 2024 |
$1,889,834
|
| Mar 2024 |
$1,889,834
|
| Feb 2024 |
$1,889,834
|
| Jan 2024 |
$1,889,834
|
Household Income
The average household income in Calabasas, CA grew from $111,111 to $114,143 in the past year. This data is an estimate based upon 8,904 households in Calabasas, CA . The chart below presents how household income is distributed in Calabasas, CA in comparison to the revenue allocation amid households nationally.
Property Value
According to data from last year, the average property value in Calabasas, CA shifted from $926,800 to $976,300 throughout the year. The subsequent graph indicates the share of properties in the given price range in Calabasas, CA in comparison to the median property value in the same price segment across the country. According to the data, the greatest share of Calabasas, CA properties falls in the '$1,000,000 to $1,499,999' range, which is higher than the most significant median property across the country.
Rent vs. Own
Property Taxes
One of the most important aspects for property owners is the amount of property taxes. This graph shows distribution of property taxes in Calabasas, CA compared to median property taxes around the country. The prevalent amount of property taxes in Calabasas, CA equals $3000, which is less than the national average.