California City, CA, USA apartments for sale

$469,900
$469,900
Available: Right Now
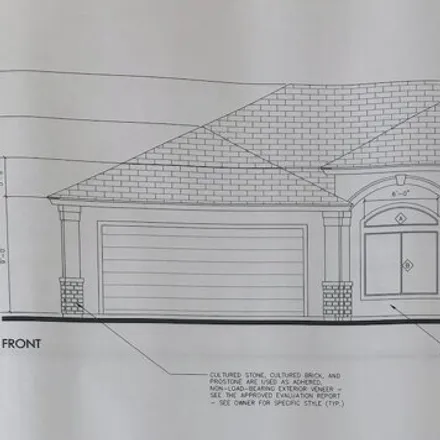
Introducing a meticulously crafted oasis nestled in the heart of California City, CA, built by the esteemed High Desert Development Construction. This custom new construction boasts 1909 square feet of luxurious living space, meticulously designed to...

$295,000
$295,000
Available: Right Now
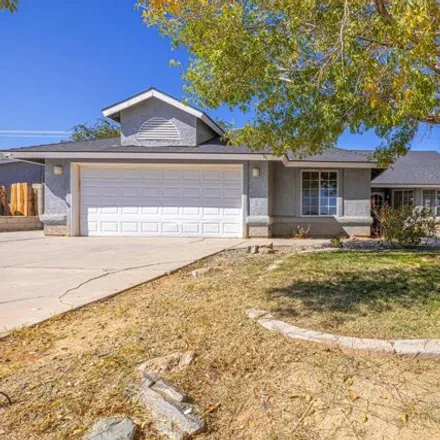
Short on commute, long on enjoyment! This captivating 4-bedroom, 2-bathroom home is perfectly situated in California City. Painless commute to Edwards AFB. Step from the Welcome mat into an interior embrace that includes an open layout, stylish light...

$449,900
$449,900
Available: Right Now
Welcome to Monte Vista Estate located on the North Side of California City. Gorgeous 2330 sq.ft. 4 Bedrooms and 1 3/4 Baths on14, 810sq.ft. Lot. Interior Features include a open floorplan, Vaulted Ceilings, Living and Family Room with a Bonus Room. S...
$599,000
$599,000
Available: Right Now
Welcome to your dream home! This exquisite single-family residence in California City offers a perfect blend of luxury and comfort. Immerse yourself in the spaciousness of this 3-bedroom, 3-bathroom home, spanning3, 127sq feet. Each bedroom is though...

$478,000
$478,000
Available: Right Now
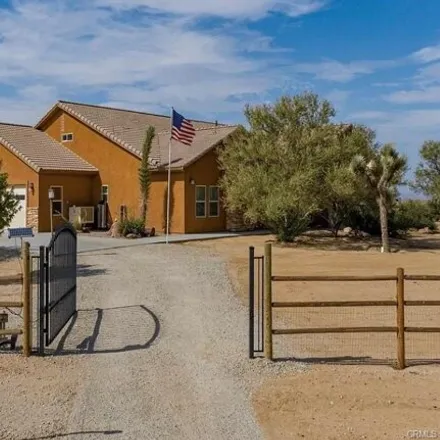
This meticulously crafted California City Custom Built home offers the perfect blend of comfort and luxury, all nestled on a sprawling 2.5-acre parcel. Take note of the custom touches throughout, Red Oak Cabinets, fireplace and wood stove, over impro...

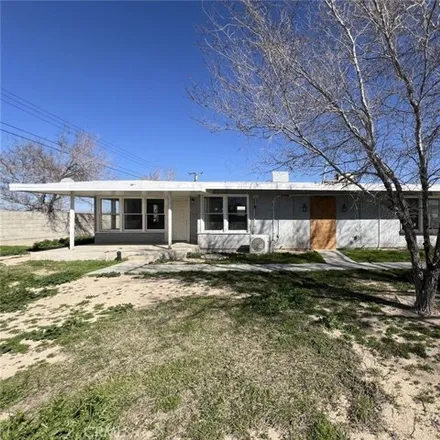
$279,900
$279,900
Available: Right Now
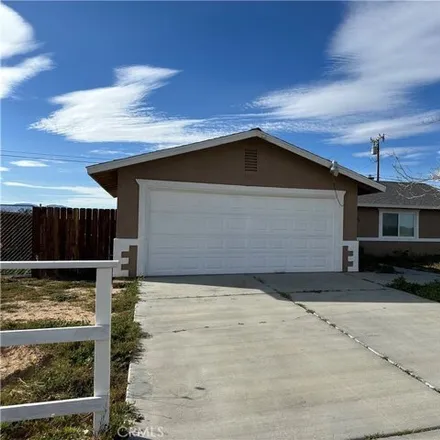
Affordable and move-in ready 4-bedroom home that offers over1, 200square feet of living space and over7, 400square foot lot. This beautiful home also offers newer stainless-steel appliances, interior and exterior paint, newer flooring throughout, new...
$335,000
$335,000
Available: Right Now
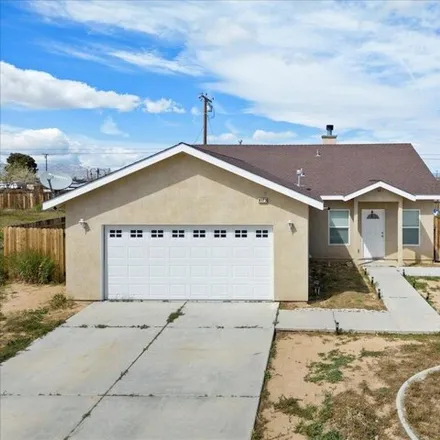
Located minutes away from various schools, parks, restaurants and the Public Library, this spacious home has been completely refurbished. With a floor-to-ceiling tiled fireplace, the open floor design is perfect to entertain guests or enjoy a cozy mo...

$349,900
$349,900
Available: Right Now
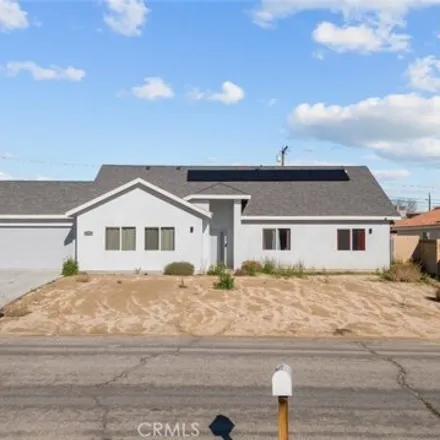
4 bedroom New Construction! Bathed in natural light, with an open floor plan! This home is perfect for modern living, and the peace of mind that comes with paid solar panels!Seamlessly connect the kitchen, dining area, and living room, creating a per...

$600,000
$600,000
Available: Right Now
This beautiful Move-In ready two story Spanish style custom home nestled on a hill of a secluded place with panoramic view situated on 2.5 acres corner lot in California City. This home can be a great starter home Or vacation home for those who wish ...
$315,000
$315,000
Available: Right Now
8173 Viburnum is a beautifully modern home built in 2006 located in California City, CA. This home comes with a abundance of natural light and boasts 3 large bedrooms 2 full bathrooms, 2 car garage, indoor laundry on a large lot with room for a futur...
$450,000
$450,000
Available: Right Now
Welcome to this remarkable single-story residence nestled in California City, boasting four bedrooms and three bathrooms spread across a spacious2, 137square feet of living space. Situated on an expansive10, 400square foot lot, this home offers ample...

$274,950
$274,950
Available: Right Now
Welcome to the epitome of South Loop living - a true gem boasting 3 bedrooms and 2 bathrooms! Step into a kitchen designed for culinary mastery, with its u-shaped layout ensuring seamless workflow and effortless meal preparation. Adjacent, discover t...

$250,000
$250,000
Available: Right Now
Single home available for sale. make an offer. 7 photos are old condition and last 2 are more current condition. occupied by non tenants non paying occupants. may be removed. call broker for information. the s e corner of 77th Street and ca...

$555,000
$555,000
Available: Right Now
Great Investment Opportunity, All units are rented and producing Income. PurchaseFHA/ VA,live in one and rent the other 3 or as a cash producing investment property. Down the street from the Golf Course and minutes away from the shopping area. One un...
$157,500
$157,500
Available: Right Now
Discover an extraordinary investment opportunity awaiting in North Edwards! This charming duplex, although in need of some tender loving care, offers immense potential with its 2 bedrooms and 4 bathrooms configuration. The space in this duplex allows...
$320,000
$320,000
Available: Right Now
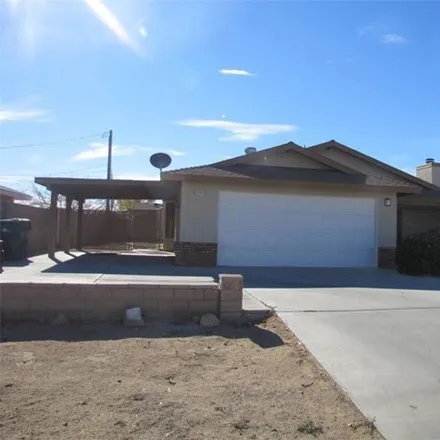
This beautiful single story home is located close to schools! With its large lot you will have plenty of room for your RV and other toys. The backyard is completely fenced with a block wall and wrought iron gates. Throughout the home there is oak cab...
$289,900
$289,900
Available: Right Now
Attention 1st time home buyers and/or investors !!! This 3 bedroom 2 bath cornet lot home with 1667 sq ft of living space on a 9300 sq ft lot has great potential for a family with vision. 2 car attached garage with room for multiple cars to...
$469,999
$469,999
Available: Right Now
Select the finishes of your Brand new home. This 1908 sq ft home features three bedroom, 1.75 bath open kitchen to the family room. The master suite includes an en-suite bathroom with a large enclosed shower and a walk-in closet. Another highl...

$350,000
$350,000
Available: Right Now
Welcome to your dream home! This brand new, modern house is the epitome of comfort and luxury. It has13, 381sq, feet lot and most importantly it is a zoneRM1/RM2that allows you to build more units on this lot. It has and open kitchen that seamlessly ...

$325,000
$325,000
Available: Right Now
Welcome to Orchid Dr. In California City, This beautiful home has three bedrooms / two full bathrooms, attached two car fully insulated and finished garage, an open floorpan starting in the kitchen with inclusion to the family room and fireplace, amp...

$429,000
$429,000
Available: Right Now
Great property located on the North side of town !, Large lot over14, 000sf. 2 Car attached Garage. Extended Driveway. Green house ,. Wooden and Block Fence , Dining Room, Family Room, Laundry Room and Enclosed Sun room. Ceiling Fans and water proof ...

$269,900
$269,900
Available: Right Now
This California City Home radiates charm and character. Great opportunity for 1st time homebuyers or Investors. With its rich and inviting spaces, this 3 Bed 2 Bath Home offers a cozy and welcoming living room for those cozy nights by the fireplace. ...
California City
According to statistics, the population in California City, CA amounts to 13,495, which shows growth 1% compared to the previous year. The median age of the city’s residents is 34. The average household income is $45,179, shifting decline -7% from the past year, and the average property value in California City, CA growth 10% to $102,000 throughout the year.
| Population | 13,495 |
| Median Age | 33.6 |
| Poverty Rate | 30% |
| Household Income | $45,179 |
| Number Of Employees | 3,780 |
| Median Property Value | $102,000 |
What is the Average Price of Apartments for Sale in California City, CA?
| Month | Median Price |
|---|---|
| Jun 2024 |
$294,043
|
| May 2024 |
$293,689
|
| Apr 2024 |
$291,683
|
| Mar 2024 |
$291,683
|
| Feb 2024 |
$291,683
|
| Jan 2024 |
$291,683
|
| Month | Median Price |
|---|---|
| Jun 2024 |
$322,989
|
| May 2024 |
$308,107
|
| Apr 2024 |
$304,473
|
| Mar 2024 |
$304,473
|
| Feb 2024 |
$304,473
|
| Jan 2024 |
$304,473
|
Household Income
The average household income in California City, CA declined from $48,776 to $45,179 in the past year. This data is an estimate based upon 4,118 households in California City, CA . The chart below presents how household income is distributed in California City, CA in comparison to the revenue allocation amid households nationally.
Property Value
According to data from last year, the average property value in California City, CA shifted from $93,000 to $102,000 throughout the year. The subsequent graph indicates the share of properties in the given price range in California City, CA in comparison to the median property value in the same price segment across the country. According to the data, the greatest share of California City, CA properties falls in the '$100,000 to $124,999' range, which is higher than the most significant median property across the country.
Rent vs. Own
Property Taxes
One of the most important aspects for property owners is the amount of property taxes. This graph shows distribution of property taxes in California City, CA compared to median property taxes around the country. The prevalent amount of property taxes in California City, CA equals $1150, which is less than the national average.