Camden, NJ, USA apartments for sale

$330,000
$330,000
Available: Right Now
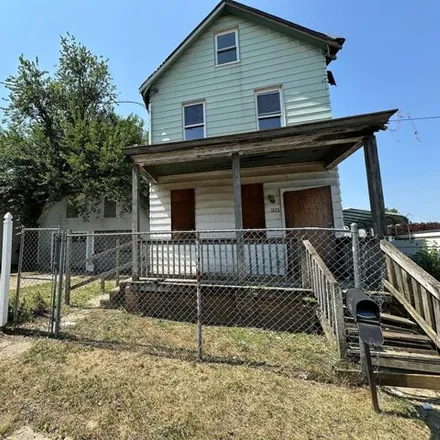
1324 Walnut Avenue is a charming brick bungalow that has been lovingly cared for by the current owners. Upgrades in the last few years include a fully remodeled kitchen, two remodeled full bathrooms, and a new roof. Downstairs the layout is split bet...
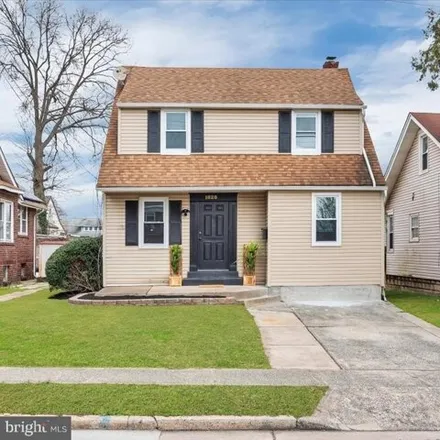
$390,000
$390,000
Available: Right Now
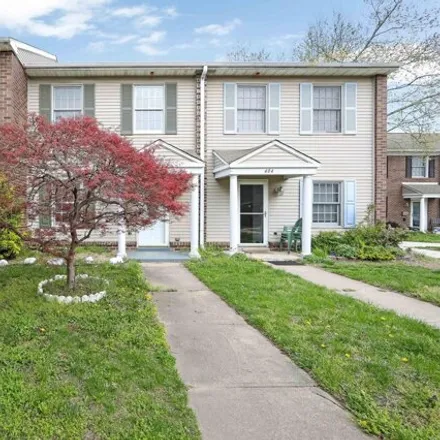
Welcome to your next home - a completely renovated gem that promises peace of mind combined with the modern living you've been searching for. This turn-key property has been meticulously updated from top to bottom, ensuring you can move in without wo...
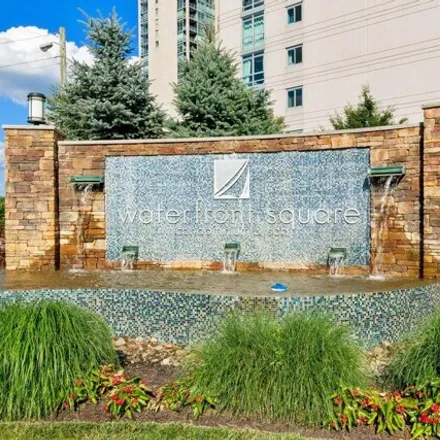
$319,000
$319,000
Available: Right Now
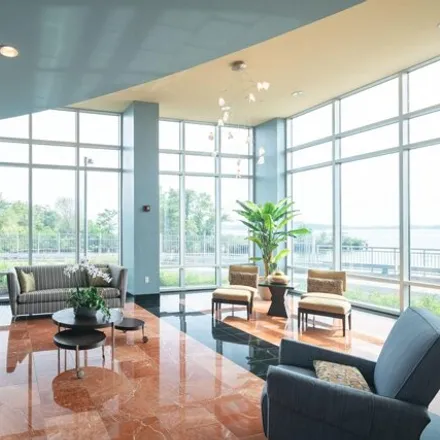
Welcome to Waterfront Square ! This unit has hardwood floors through out, marble bath and includes one car parking. This beautiful Condo offers great Northern views of the Delaware River and Panoramic skyline views of Philadelphia. Waterfront Square ...
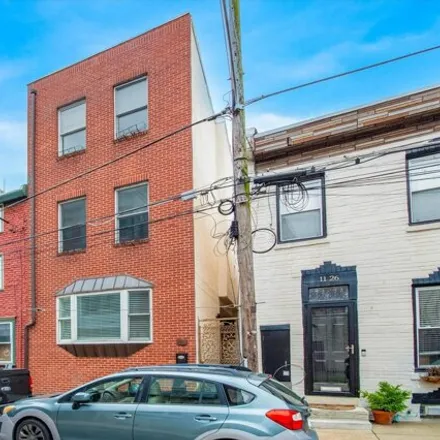
$599,000
$599,000
Available: Right Now
Fantastic opportunity to own a custom built three story home located in the desirable Riverside of Fishtown/Northern Liberties section of Philadelphia designed by G.J. Olso Architects. This property is located minutes from all the culture, arts, dini...

$599,000
$599,000
Available: Right Now
Stunning......Walk into this Light Filled Condominium with 10ft Ceilings and Walls of Windows.Waterfront Square is Philadelphia's Best Kept Secret. Enjoy Tranquil up River Views and the Skyline of Philadelphia in this Tastefully Decorated Condo , whi...
$208,900
$208,900
Available: Right Now
Offering a spacious 2 bedrooms 1 bath with many upgrades. Great opportunity for first time buyers or our local investers priced to sell! Call me to schedule your personel tour of this or any other available property you might be interested in!!!! Ask...
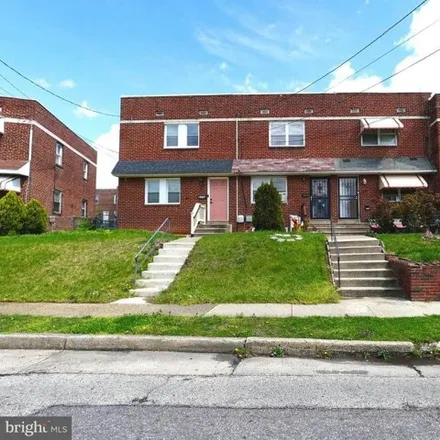
$489,900
$489,900
Available: Right Now
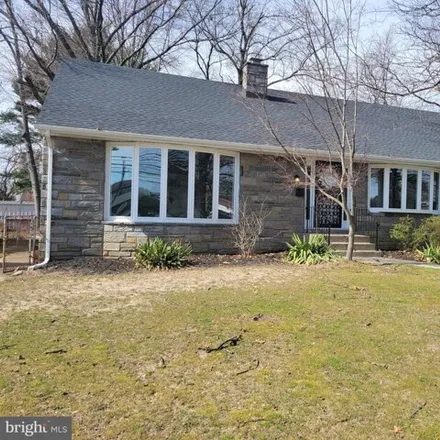
Welcome to this renovated, raised ranch with 4 floors of living located on a large, fenced lot in Pennsauken. Home features a formal living room and dining room, both with large bay windows; a totally brand new eat in kitchen featuring white cabinets...
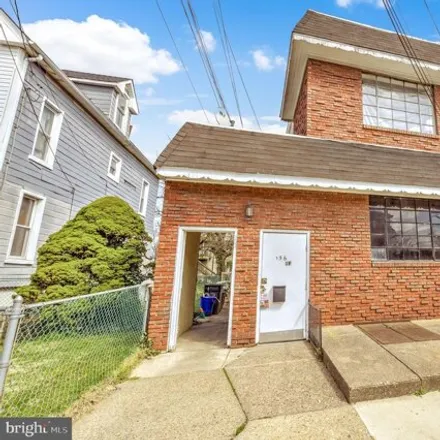
$175,000
$175,000
Available: Right Now
BEST and Final offers due sunday (5/5)@8:00PM Newer home in extremely close proximity to Camden's everBOOMINGWaterfront, featuring updated flooring, 6-paneled doors, contemporary fixtures and generous storage throughout. Half bathroom located ...

$449,900
$449,900
Available: Right Now
Welcome to this charming 4-Bedroom craftsman style home in Haddon Township which has been lovingly cared for by the same owners for 50+ years and is ready for it's chapter. This beautifully maintained Craftsman-style home, boasting2, 300square feet o...

$549,000
$549,000
Available: Right Now
Welcome to110 E.Clinton Ave, a beautifully renovated gem in the heart of Haddon Township. This charming home boasts three generously sized bedrooms, each designed with comfort in mind, and two elegantly updated bathrooms featuring modern fixtures and...
$170,000
$170,000
Available: Right Now
Cramer hill special !!! Are you ready to create the home you've always envisioned? Unlock the potential of this expansive 5-bedroom, 2 full bath home, perfect for those with a vision for renovation. Situated in a great neighborhood, close to S...

$230,000
$230,000
Available: Right Now
The party starts, and stays, here! Currently a Social club, you can bring your small business, social club, or just a group of friends who need a place to socialize, to this Awesome multi-use income-generating property. It is being O...
$489,500
$489,500
Available: Right Now
Stunning two-bedroom, two-bathroom residence boasting 10-foot ceilings and expansive windows, nestled within the prestigious gated enclave of Waterfront Square. Experience unparalleled resort-style living with meticulously adorned interiors featuring...

$150,000
$150,000
Available: Right Now
Welcome to this spacious 4-bedroom, 1-bathroom home offering tremendous potential in Gloucester City, NJ. Situated on a generous lot with an additional side lot, this property presents an excellent opportunity for buyers looking to personalize and re...
$325,000
$325,000
Available: Right Now
Welcome to these 4 unit brick/stucco building on the border of Woodlynne and Oaklyn. The 1st floor and 2nd floor are essentially copies of each other. In the front of the building are the two 1 bedroom units, which include modest living room, smaller...
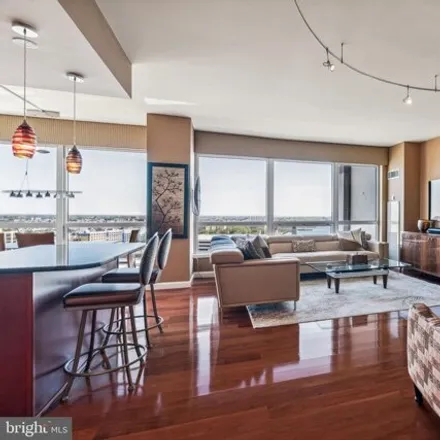
$615,000
$615,000
Available: Right Now
Enjoy expansive views, urban serenity, and a luxurious lifestyle offered by Philadelphia's premier waterfront community! This sprawling two-bedroom, two and a half-bath corner residence with a privateBALCONYand one-carPARKINGboasts gleaming hardwood ...

$250,000
$250,000
Available: Right Now
This Bungalow style home, on a quiet street in Oaklyn is an opportunity that is not to be missed! The property is nestled into a neighborhood, which also has quick access to major roads and throughways, easy travel in and out of Philadelphia, and a s...

$65,000
$65,000
Available: Right Now
Investor alert !!! Multifamily Property in Bergen Square section ofBOOMINGCamden located directly across the street from KIPP High School and New Fellowship Church. Blank slate - the possibilities are endless! Strictly As-Is Sale. Buyer is res...
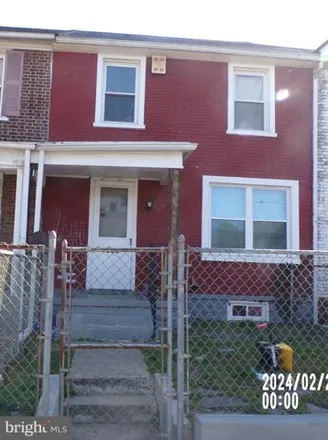
$150,000
$150,000
Available: Right Now
Come one come all this Property will not last on the market. This cozy 3 bedroom 1 bath home is nestled in a small up and coming neighborhood. This home has additional parking in the back of house. Ideal for investors seek the opportunity to bring in...

$225,000
$225,000
Available: Right Now
Coming soon ! Diamond in the Rough 8900SF+ Lot, 2500SFEnd of Row Home. A unique development opportunity in Camden, New Jersey. This property boasts2, 517square feet of above-ground living space. The residential building features 13 rooms with ...
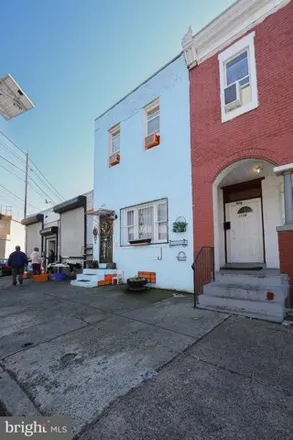
$174,900
$174,900
Available: Right Now
Investor alert. Mixed use opportunity in the Desirable and consistently improving Parkside section ofBOOMINGCamden. Extremely well maintained 3 bedroom row home with long term tenant currently on a MTM double net lease. Subject to existing lea...
$665,000
$665,000
Available: Right Now
Open House: Sunday, April28 - 11:30am-1:30pm. How does having a beautiful Park with a lake as your view from your Ranch style home sound? Amazing right! That's what you will find at this rehabbed home with all the bells and whistles to go with the vi...
Camden
According to statistics, the population in Camden, NJ amounts to 75,550, which shows decline -1% compared to the previous year. The median age of the city’s residents is 30. The average household income is $26,105, shifting decline 0% from the past year, and the average property value in Camden, NJ decline -1% to $82,300 throughout the year.
| Population | 75,550 |
| Median Age | 29.9 |
| Poverty Rate | 37% |
| Household Income | $26,105 |
| Number Of Employees | 26,362 |
| Median Property Value | $82,300 |
What is the Average Price of Apartments for Sale in Camden, NJ?
| Month | Median Price |
|---|---|
| Jun 2024 |
$215,938
|
| May 2024 |
$207,394
|
| Apr 2024 |
$237,588
|
| Mar 2024 |
$237,588
|
| Feb 2024 |
$237,588
|
| Jan 2024 |
$237,588
|
| Month | Median Price |
|---|---|
| Jun 2024 |
$278,494
|
| May 2024 |
$266,949
|
| Apr 2024 |
$301,113
|
| Mar 2024 |
$301,113
|
| Feb 2024 |
$301,113
|
| Jan 2024 |
$301,113
|
Household Income
The average household income in Camden, NJ declined from $26,214 to $26,105 in the past year. This data is an estimate based upon 25,195 households in Camden, NJ . The chart below presents how household income is distributed in Camden, NJ in comparison to the revenue allocation amid households nationally.
Property Value
According to data from last year, the average property value in Camden, NJ shifted from $82,800 to $82,300 throughout the year. The subsequent graph indicates the share of properties in the given price range in Camden, NJ in comparison to the median property value in the same price segment across the country. According to the data, the greatest share of Camden, NJ properties falls in the '$80,000 to $89,999' range, which is lower than the most significant median property across the country.
Rent vs. Own
Property Taxes
One of the most important aspects for property owners is the amount of property taxes. This graph shows distribution of property taxes in Camden, NJ compared to median property taxes around the country. The prevalent amount of property taxes in Camden, NJ equals $2500, which is less than the national average.