Canonsburg, PA, USA apartments for sale

$229,900
$229,900
Available: Right Now
Newly Renovated 4 Bedroom Home in Canonsburg! Updated kitchen including new cabinets, quartz countertop and stainless steel appliances. Updated bathrooms with new plumbing, tubs, fixtures, vanities, and tile. New flooring, lighting and paint. Even th...
$925,000
$925,000
Available: Right Now
We are proud to present 1018 Belvedere Ct a 3 years young custom home in the Alto Piano neighborhood of Southpointe. This home has it all from the beautiful open concept floor plan to the magnificent timbers carried through the home. The home feature...

$429,900
$429,900
Available: Right Now
You'll be in awe over 1173 Bayberry. ThisEND UNITtownhome has been 100% updated and sits perfectly in a cul-de-sac ( Sunset views ). Professional remodeling (2020) include: LVP flooring everywhere; new kitchen; new deck, patio, landscaping (w/...

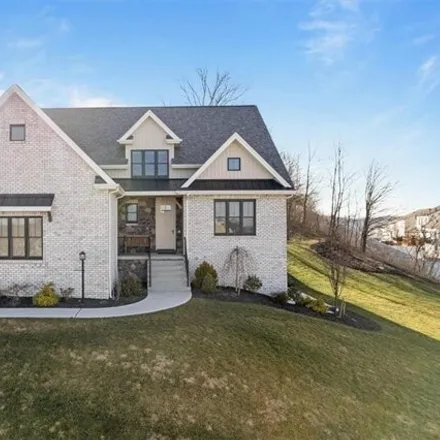
$829,900
$829,900
Available: Right Now
Custom Graziani Homes 5-bedroom Brick and Stone, 4.5 Bath, 3-Car attached garage Masterpiece! Finished basement with media room, office, custom Cherry wet bar, lower level family room/game room, and 5th bedroom. Master suite with illuminated tray cei...

$190,000
$190,000
Available: Right Now
Welcome home to 114 Arnold Ave! This charming home offers 3 bedrooms and 2 full bathrooms. In addition, it boasts a flatter backyard, encompassed by a privacy fence. Within the perimeter of the property includes a shed and raised garden beds to meet ...

$640,000
$640,000
Available: Right Now
Looking for a nice comfortable size lot but still in a neighborhood? Look no further you have to see this home in person to appreciate all the amenities and pristine condition. Custom build by COSTA builders. Open concept from kitchen to the oversize...

$350,000
$350,000
Available: Right Now
You are going to love this conveniently located, luxurious condominium with fresh paint and new flooring! The chef's kitchen features beautiful dark wood cabinetry, granite countertops, S/S appliances, including a 5-burner gas stove w/ double ovens, ...
$219,800
$219,800
Available: Right Now
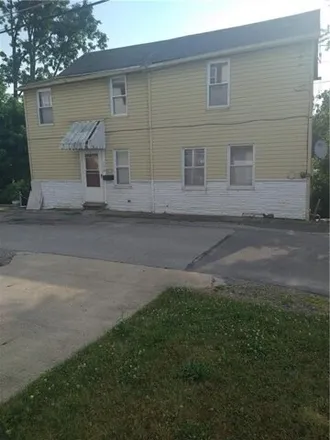
Fully rented ALL Brick, East end Canonsburg Brick up and down all brick Duplex, remodeled and TurnKey~ Great investment! 2 bed one bath on main level Covered front porch~~ Lower level is 3 bed, 1.5 bath w an office. LARGEkitchen, master has access to...
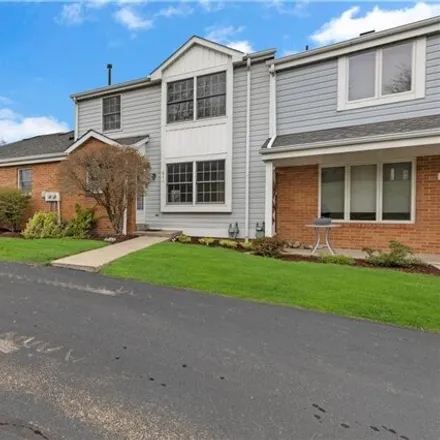
$285,000
$285,000
Available: Right Now
Extrememly spacious townhouse in prime lacation close to 79.Freshly painted and new engineered wood flooring in Living room and dining room, new carpeting in second floor.Hardwood floors and new granite countertops in kitchen.All appliances stay as w...

$209,900
$209,900
Available: Right Now
Convenience at its finest with this 3 bedroom 2.5 bath Condo! Located directly off I-79 making any commute a breeze. The main level has newer flooring throughout. Kitchen is perfect size for all of your cooking needs. The Living room is great size an...
$135,000
$135,000
Available: Right Now
Prime Opportunity in Canonsburg. Discover the potential of this versatile Canonsburg property, perfect for a growing family or as a lucrative two-unit rental. The main level boasts a spacious living room, a well-appointed kitchen, two comfortable bed...

$259,900
$259,900
Available: Right Now
Perfect ! Level Living in Beautiful and Conveniently Located Victoria Court w/Maintenance Free Living! Level Driveway and a 2 Car Attached Garage make this Beautiful Patio Home a Dream to Live In! Open, Light and Bright w/Cathedral Ceiling in Open En...

$265,000
$265,000
Available: Right Now
Welcome to your dream home! This charming raised-ranch style home offers the perfect blend of comfort and convenience with an open floor plan. 3 cute bedrooms with 2 full baths provides plenty of space. Step inside to find a large family room, perfec...

$215,900
$215,900
Available: Right Now
Move right in to this ranch home perfect for entertaining. The home is situated on a fenced in double lot and has a deck off the dining room that overlooks the inground pool with concrete pool deck. Large kitchen with a dining area and stainless stee...

$165,000
$165,000
Available: Right Now
Located in the heart of Canonsburg and walking distance to beautiful Town Park/Pool and Joe's Candy shop, this home features contemporary design elements with a splash of country-chic stylish details. The Spacious living room features a full w...
$129,000
$129,000
Available: Right Now
Become a homeowner in canonsburg school district with this two bedroom home. owner used as an investment property. first floor has kitchen and living room. two bedrooms upstairs with full bathroom. main bedroom has a large space for either extra c...

$1,2M
$1,2M
Available: Right Now
Unlock the potential of over 12 acres of prime land in the Canon McMillan School District. This exceptional parcel offers a rare chance to create a stunning residential development. Located within easy reach of Southpointe, the Southern Beltway, the ...
$264,900
$264,900
Available: Right Now
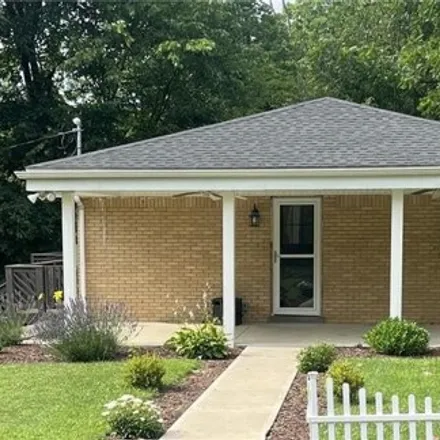
Welcome to 36 Burnside Road. This cozy all brick home in Cecil Township is move in ready!! The main floor has 3 bedrooms and full bath while the basement has a brand new bedroom/den and full bath.The updated kitchen has newer stainless steel applianc...

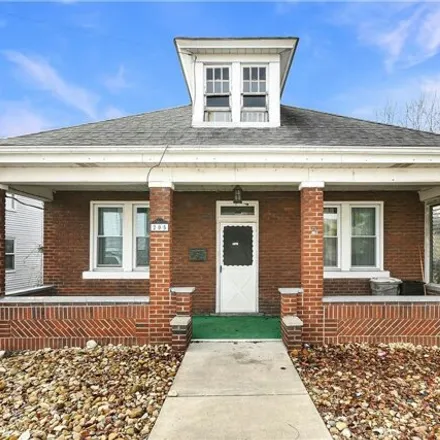
$270,000
$270,000
Available: Right Now
Step into 332 Ridge Ave, a charming Cape Cod-style home meticulously renovated to pristine condition. This home boasts an array of new enhancements. Discover a newly transformed interior, featuring a new kitchen adorned w sleek cabinets and counterto...

$357,500
$357,500
Available: Right Now
Welcome to 408 Olive Lane, nestled in the heart of Weavertown Pointe Beautifully maintained property boasts a blend of classic charm and modern amenities Set at the end of a quiet cul-de-sac, this end unit townhome includes a beautiful side yard, fla...

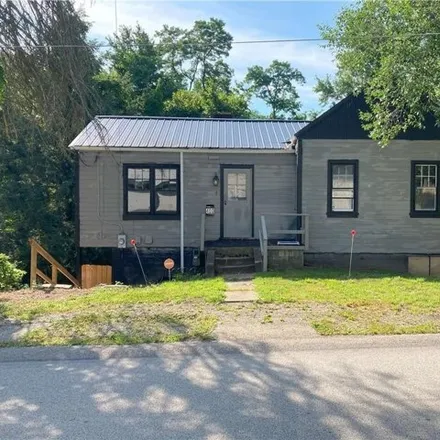
$59,900
$59,900
Available: Right Now
Lots of room throughout this house. With a little elbow grease these 3 bed/2.5 baths would make a grand home. House has 2 kitchen, 1 upstairs and 1 downstairs. Located on a corner lot, with a fenced yard. 2 car detached garage....

$99,900
$99,900
Available: Right Now
Perfect starter home or downsizer! A deck leads to this one level living features two-bedroom and one bath. Gorgeous hardwood flooring. An eat-in-kitchen boasts stainless appliances. Natural sunlight floods the living room though a bay window. One-ca...
Canonsburg
According to statistics, the population in Canonsburg, PA amounts to 8,913, which shows decline 0% compared to the previous year. The median age of the city’s residents is 40. The average household income is $52,268, shifting growth 4% from the past year, and the average property value in Canonsburg, PA growth 6% to $137,500 throughout the year.
| Population | 8,913 |
| Median Age | 39.9 |
| Poverty Rate | 11% |
| Household Income | $52,268 |
| Number Of Employees | 4,525 |
| Median Property Value | $137,500 |
Household Income
The average household income in Canonsburg, PA grew from $50,399 to $52,268 in the past year. This data is an estimate based upon 3,926 households in Canonsburg, PA . The chart below presents how household income is distributed in Canonsburg, PA in comparison to the revenue allocation amid households nationally.
Property Value
According to data from last year, the average property value in Canonsburg, PA shifted from $129,800 to $137,500 throughout the year. The subsequent graph indicates the share of properties in the given price range in Canonsburg, PA in comparison to the median property value in the same price segment across the country. According to the data, the greatest share of Canonsburg, PA properties falls in the '$100,000 to $124,999' range, which is lower than the most significant median property across the country.
Rent vs. Own
Property Taxes
One of the most important aspects for property owners is the amount of property taxes. This graph shows distribution of property taxes in Canonsburg, PA compared to median property taxes around the country. The prevalent amount of property taxes in Canonsburg, PA equals $1150, which is less than the national average.