Cape Coral, FL, USA apartments for sale

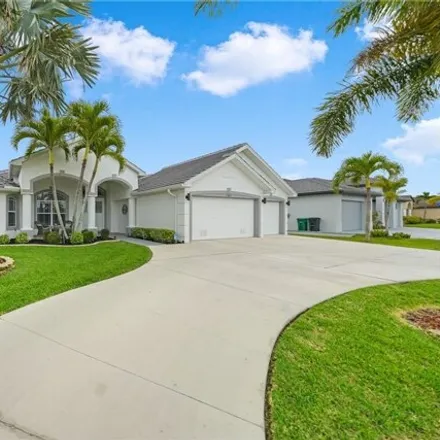
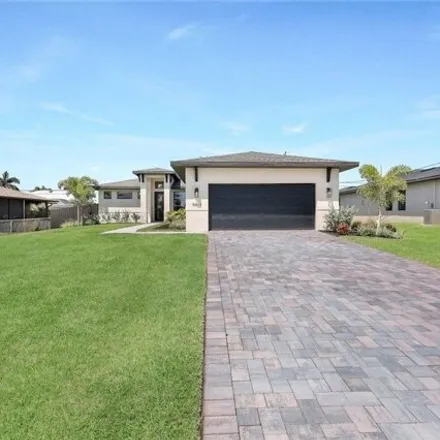
$639,000
$639,000
Available: Right Now
Discover your slice of paradise in Cape Coral, Florida, with this impeccably upgraded 3 bedroom + Den, 2 bathroom pool home. Nestled in a serene neighborhood, this property embodies both luxury and functionality, boasting numerous recent upgrades and...

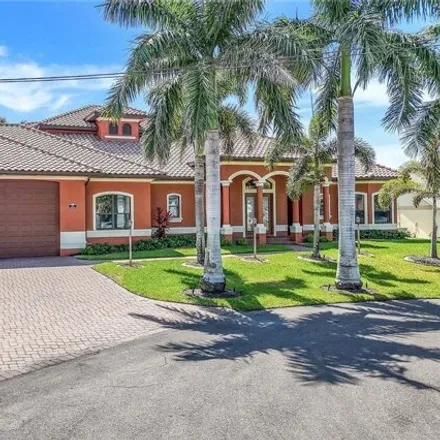
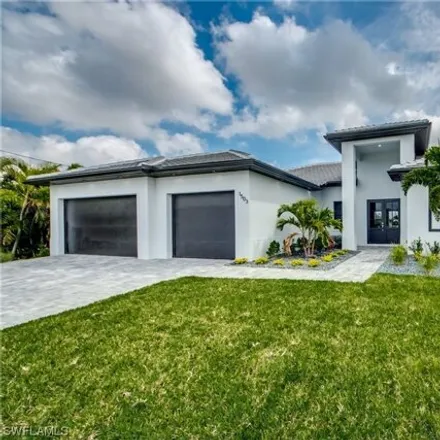
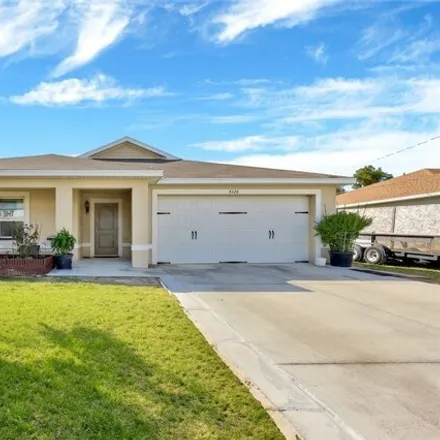
$540,000
$540,000
Available: Right Now
Welcome to your dream home! This exquisite modern residence offers a perfect blend of luxury, comfort and functionality. Situated in a quiet but conveniently located neighborhood, this spacious home is designed to cater to all your needs. The expansi...

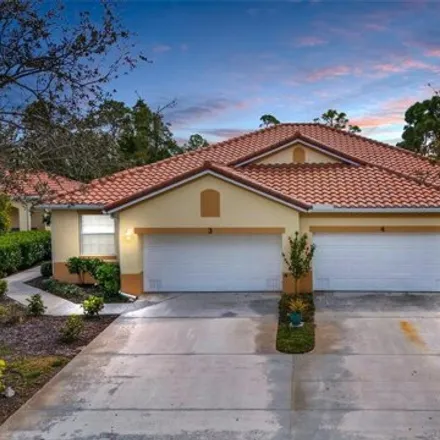
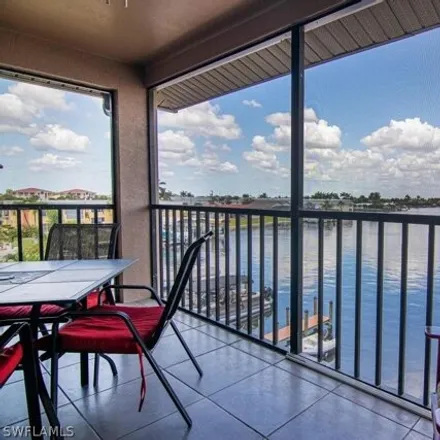
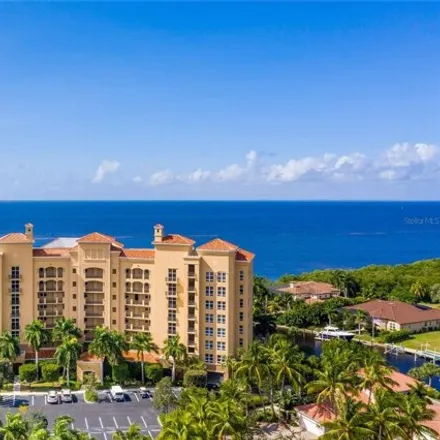
$368,500
$368,500
Available: Right Now
Tuscany Court offers a unique opportunity to own a stunning condo in the sought-after SW Cape Coral area. This top floor unit, provides breathtaking views of the courtyard and fountain. With elevator access, this condo offers convenience and luxury. ...
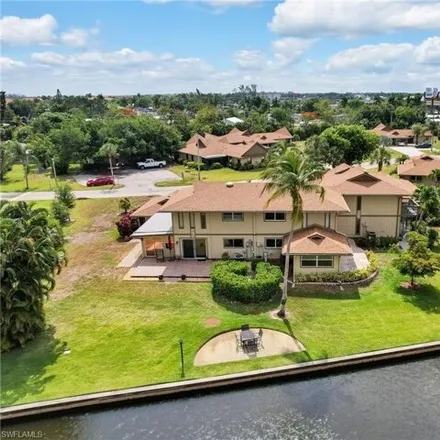
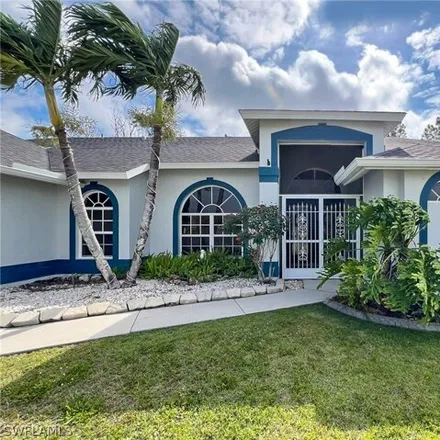
$575,000
$575,000
Available: Right Now
Introducing an exquisite residence nestled in the highly coveted SW Cape Coral neighborhood! This stunning pool home offers over2, 300Sq. Ft. of opulent living space, meticulously designed to harmonize comfort with sophistication. Upon entry, be gree...
$2,95M
$2,95M
Available: Right Now
Welcome to your exquisite waterfront estate home in one of Cape Coral's finest locations with 140 ft of water frontage and deep water sailboat access! This two-story haven boasts unparalleled vistas of the Bimini Canal and Caloosahatchee River. Profe...
$360,000
$360,000
Available: Right Now
Experience tropical paradise living in the Resort Villas of Burnt Store Marina. This meticulously updated 2-bedroom, 2-bath villa with a den that boasts a new roof and hurricane impact windows in the majority of the villa, ensuring both style and saf...

$459,900
$459,900
Available: Right Now
Spacious living areas with soaring cathedral ceilings and an open floor plan, including a centrally located island kitchen. Step out from the large living room onto the well enjoyed covered and screened lanai, perfect for embracing the vibrant Southw...

$539,000
$539,000
Available: Right Now
Beautiful Under Construction Pool home the Lago Model to be completed by end of June 2024. House is located in the Heart of Cape Coral with Assessments paid. Quality work and materials thru out the house with high ceilings , 8ft doors and 6 inch base...
$325,000
$325,000
Available: Right Now
Look at that location!! Prepare to be amazed by the stunning views from every window in this exceptional newly updated condo. This unit is truly a must-see, located in the friendly and highly desirable community of Caloosa Bayview Village within the ...
$1,4M
$1,4M
Available: Right Now
This custom Gulf access 4 bed, 3 bath, 3 car garage home has all the bells and whistles. The chefs kitchen boasts upgrades including double rowed wooden cabinets, high end Kitchen aid stainless appliances including a Slide in range, an oversized quar...
$325,000
$325,000
Available: Right Now
Paradise found !!!!! Live the southwest florida lifestyle !!!!! All furniture and contents included. move right in just bring your toothbrush. beautiful waterfront unit looking straight down 200 ft. wide gulf access canal with amazin...
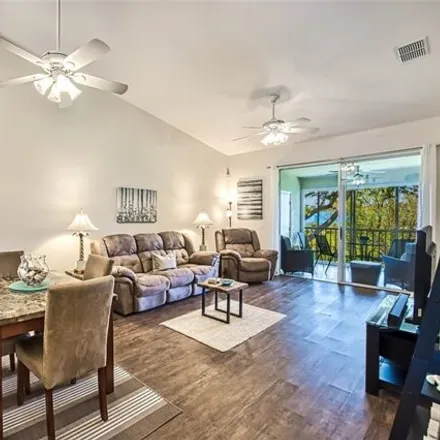
$295,000
$295,000
Available: Right Now
Welcome home... to your turnkey impeccably well taken care of condo in Parker Lakes. Featuring 2 bedrooms + Den with 2 bathrooms. Open floor plan that boast vaulted ceilings and a kitchen that overlooks seamless living space to your dining are...
$349,900
$349,900
Available: Right Now
Welcome to your new home in beautiful Cape Coral, Florida! Nestled in a quiet residential neighborhood, this charming 3-bed, 2-bath home boasts the perfect blend of comfort and convenience. Step inside to discover a welcoming atmosphere, with a layou...
$539,900
$539,900
Available: Right Now
New Construction Sunsational Homes Jazzy floor plan South of Cape Coral Parkway. Featuring 4 Bedrooms with 2 Bathrooms and Luxurious Pool. You will immediately notice the Paver driveway and Grand Entry with Stylish Stoned columns and Contemporary Lig...

$479,000
$479,000
Available: Right Now
Located on a quiet cul-de-sac and close to the heart of the Marina this beautiful furnished home with 2 bedrooms, 2 baths plus den/office has a light and bright contemporary feel. Soaring ceilings complement the stunning bamboo flooring and diamond-s...
$409,000
$409,000
Available: Right Now
A refreshing take on open concept living, this 3-bedroom, 2-bath newer home on a spacious lot is a haven of comfort and style. The ample landscaping features an assortment of trees in it's initial phrases. The open floor plan is perfect for entertain...

$529,900
$529,900
Available: Right Now
Discover your future investment opportunity in the charming city of Cape Coral! Among luxurious, newly constructed homes, find this rare Gulf access duplex property which offers an exceptional chance for rental income or Airbnb vacation rental...

$289,900
$289,900
Available: Right Now
This is the home in the location you have been looking for! Sweet location, close to Cape Coral Pkwy and within walking distance to many stores and all the restarants and entertainment areas in SE Cape Coral! Very quick access to the Yacht Club and t...

$1,2M
$1,2M
Available: Right Now
Picture yourself on a direct gulf access canal home, less than just five minutes to the Caloosahatchee River. Behind your beautiful residence there are fish jumping, dolphins swimming and the sound of laughter from your family and guests as they are ...
$625,000
$625,000
Available: Right Now
Do you love the city, but miss having more room to yourself? Here is your chance to be close to amenities, but also have the ability to spread out and enjoy your home. This spacious property is a 4-Bedroom, 2-Bathroom, 3-Car Garage Pool Home in North...
$725,000
$725,000
Available: Right Now
Come experience waterfront living at its finest in this upgraded Grande Isle condo, where million dollar views await! This renovated residence boasts high-end finishes, including extensive moldings and millwork that elevate the elegance of every room...
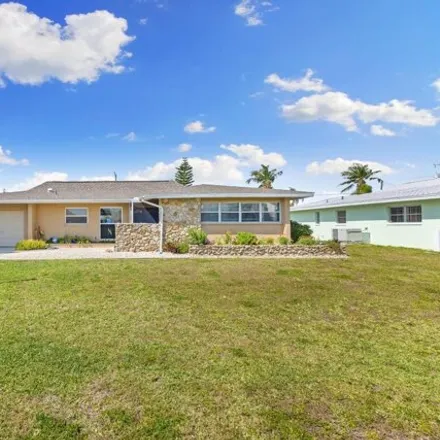
$357,000
$357,000
Available: Right Now
Step into your new home! New roof, new garage door, and not in flood zone ! This spacious3 BR/2 BAis a rare find with a large lanai/family room with a built-in bar for relaxation and entertaining! There is also a screened patio with storage cl...
Cape Coral
According to statistics, the population in Cape Coral, FL amounts to 173,679, which shows growth 2% compared to the previous year. The median age of the city’s residents is 46. The average household income is $53,653, shifting growth 3% from the past year, and the average property value in Cape Coral, FL growth 13% to $196,800 throughout the year.
| Population | 173,679 |
| Median Age | 45.9 |
| Poverty Rate | 13% |
| Household Income | $53,653 |
| Number Of Employees | 75,874 |
| Median Property Value | $196,800 |
What is the Average Price of Apartments for Sale in Cape Coral, FL?
| Month | Median Price |
|---|---|
| Jun 2024 |
$330,209
|
| May 2024 |
$319,291
|
| Apr 2024 |
$334,925
|
| Mar 2024 |
$382,139
|
| Feb 2024 |
$382,139
|
| Jan 2024 |
$382,139
|
| Month | Median Price |
|---|---|
| Jun 2024 |
$569,165
|
| May 2024 |
$595,088
|
| Apr 2024 |
$601,157
|
| Mar 2024 |
$553,913
|
| Feb 2024 |
$553,913
|
| Jan 2024 |
$553,913
|
Household Income
The average household income in Cape Coral, FL grew from $52,000 to $53,653 in the past year. This data is an estimate based upon 62,392 households in Cape Coral, FL . The chart below presents how household income is distributed in Cape Coral, FL in comparison to the revenue allocation amid households nationally.
Property Value
According to data from last year, the average property value in Cape Coral, FL shifted from $173,400 to $196,800 throughout the year. The subsequent graph indicates the share of properties in the given price range in Cape Coral, FL in comparison to the median property value in the same price segment across the country. According to the data, the greatest share of Cape Coral, FL properties falls in the '$200,000 to $249,999' range, which is lower than the most significant median property across the country.
Rent vs. Own
Property Taxes
One of the most important aspects for property owners is the amount of property taxes. This graph shows distribution of property taxes in Cape Coral, FL compared to median property taxes around the country. The prevalent amount of property taxes in Cape Coral, FL equals $3000, which is less than the national average.