Carbondale, IL, USA apartments for sale
$45,000
$45,000
Available: Right Now
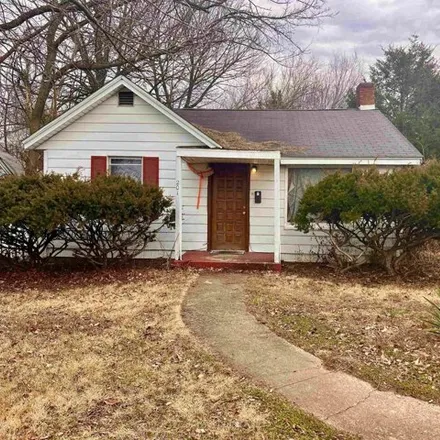
Here is your chance to purchase your first investment property! This two bedroom and 1 bathroom home is currently tenant occupied. Conveniently located near shopping and SIU. Will need 24 hour notice for showings. There are more properties listed by ...
$159,900
$159,900
Available: Right Now
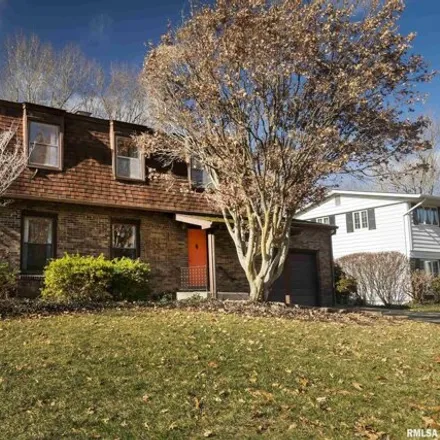
Embrace the tranquility of Carbondale living in this charming 3-bedroom, 2.5-bathroom home. Pull into the 1-car garage and step into a world of comfort. This home features a formal dining room and spacious family room, providing the perfect backdrop ...
$51,533
$51,533
Available: Right Now
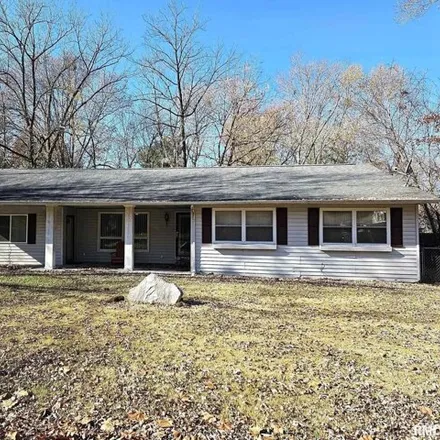
Great opportunity to invest in Carbondale rental or purchase your next home. Monthly rent$500-$600.This has been a long-time rental unit. Check out city conversion grants. Needs a few repairs. Great location and has a breeze way to a 2-car garage, pl...
$99,900
$99,900
Available: Right Now
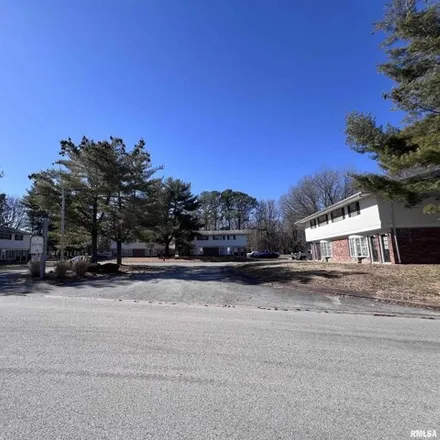
Now is your chance to pick up a money maker with two leased apartments with one ready to fill. The property is a tri-plex with, with an upstairs 2 bedroom apartment, in addition there are two ground floor apartments, a 1 bedroom, and a studio. There ...
$39,000
$39,000
Available: Right Now
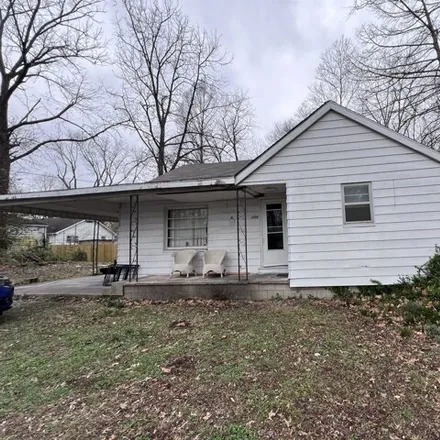
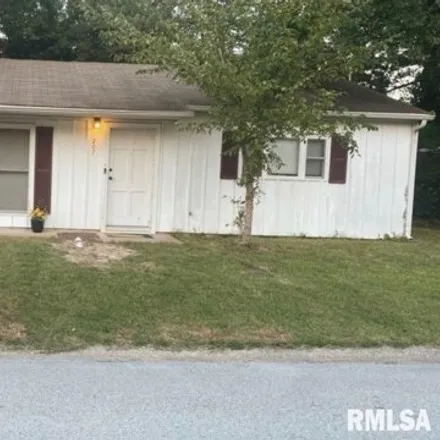
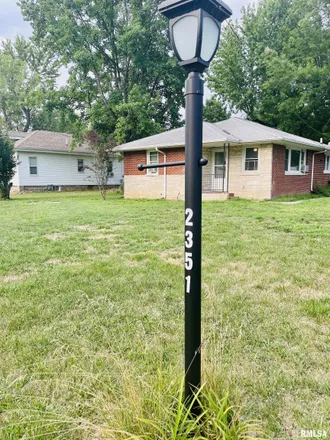
Nice home with large yard connecting to green space! Home is being rented on a month to month lease for$450.00.This is a 2 bedroom, 1 bath, living room eat in kitchen, and laundry room. Appliances included are washer, dry, range, refrigerator, gas wa...
$50,000
$50,000
Available: Right Now
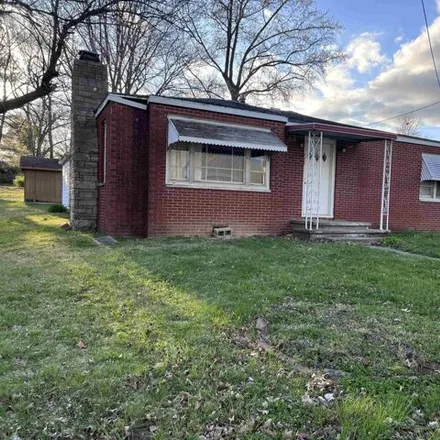
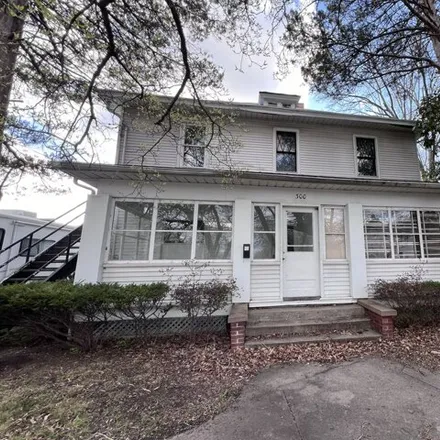
1889 build has been a home, business office, student rental to SIU baseball players. Great opportunity for Commercial, rental or purchase your next home. Zoned R2, Commercial use may need a special use permit. Monthly rent$1200.00-1500.00.Needs repai...
$190,000
$190,000
Available: Right Now
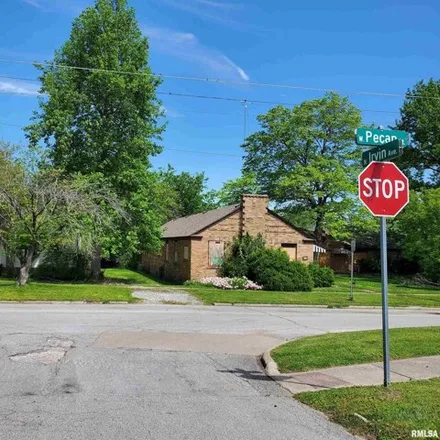
3 Parcels that include 1 Single Family Home on 1 parcel at322 W.Pecan, a 10 plex on the 2nd parcel at318 W.Pecan and a Vacant Lot on the 3rd Parcel being314 W.Pecan Street. The 10 plex has 3 units being 1 Bedroom units and 7 units are 2 bedroom units...
$47,175
$47,175
Available: Right Now
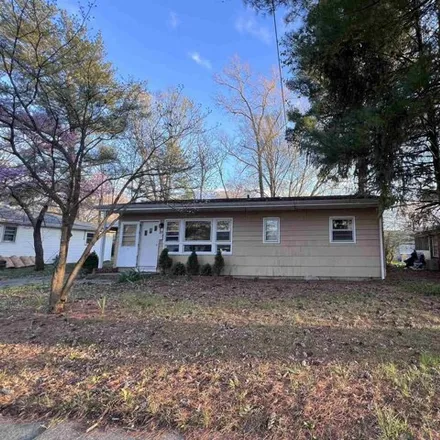
Great opportunity to invest in Carbondale rental or purchase your next home. Monthly rent$700.00.This has been a long-time rental unit. Check out city conversion grants. Needs a few repairs. Great location close to SIU, parks, and shopping! The home ...
$69,900
$69,900
Available: Right Now
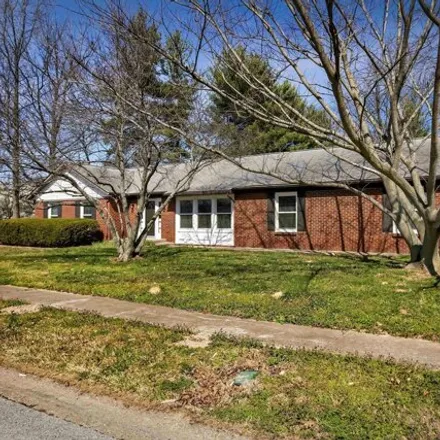
Investment opportunity! Take a look at this 2 bedroom, 1 bathroom home that is situated on a corner lot. This home features hardwood floors throughout the living room, dining room and bedrooms. Enjoy the fenced in backyard and the screened in patio o...
$249,900
$249,900
Available: Right Now
This is your opportunity to own this traditional two story home in the beautiful Paradise Acres neighborhood in Carbondale. The house has 5 bedrooms, 2.5 bathrooms, and2, 432square feet of living space with an additional1, 216square foot partially fi...
$184,500
$184,500
Available: Right Now
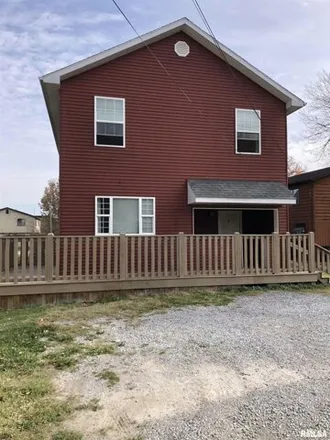
Looking for a home that makes you money? Perhaps you're looking to expand your investment portfolio or support multi-generational living? This lovely home was built in 2015 and shows it with a modern design. The home features 9ft ceilings, walls are ...
$151,000
$151,000
Available: Right Now
Lots of space with many options sits this 3 bedroom home. This home has a great sized living room with extra space for an office nook or a dining area. Off of the kitchen sits another large room that can be used for dining or as a family room. With s...
$689,000
$689,000
Available: Right Now
Welcome to Trails West at 400 N Westridge Drive, Carbondale, IL! Local owners of Trails West offer both comfort and convenience in this listing of 4 4-plex buildings each with (4) 2-bedroom apartments for sale. Each apartment has 1 bath. With its pri...
$219,900
$219,900
Available: Right Now
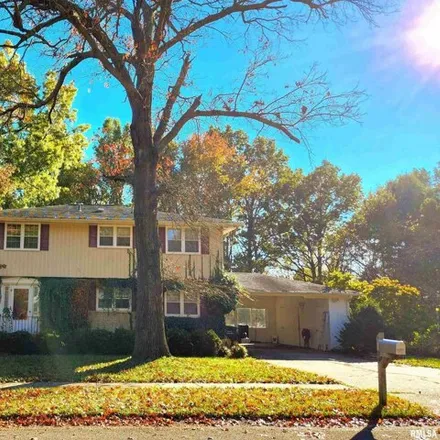
Welcome to your dream home nestled in the heart of a serene and peaceful neighborhood! This 4-bedroom, 3.5-bath residence offers the perfect blend of comfort and elegance. As you step through the front door, you'll be greeted by beautiful wood floors...
$275,000
$275,000
Available: Right Now
Welcome to Beadle, this home has been refreshed and is ready for new owners! The curb appeal is classic Carbondale but as you step into the front door you'll be surprised at all the modern finishes. There is brand new carpet and vinyl plank flooring,...
$85,000
$85,000
Available: Right Now
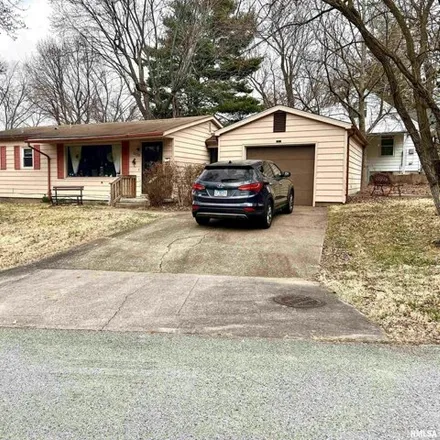
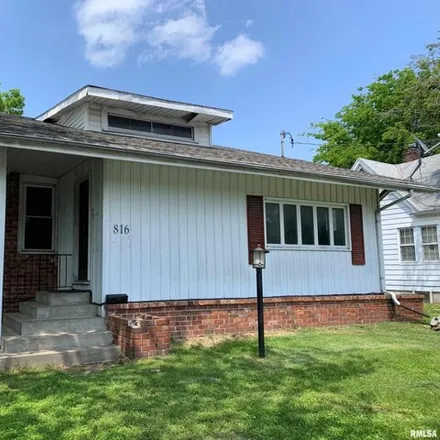
Close to everything with this conveniently located 3 bedroom, 1 bath home with attached garage, fenced yard and covered patio. Near Turley Park, Murdale, other shopping areas including the Farmers Market, and SIUC. Enjoy the eat-in kitchen with custo...
$90,000
$90,000
Available: Right Now
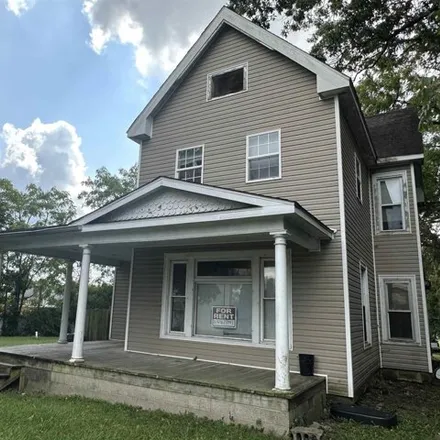
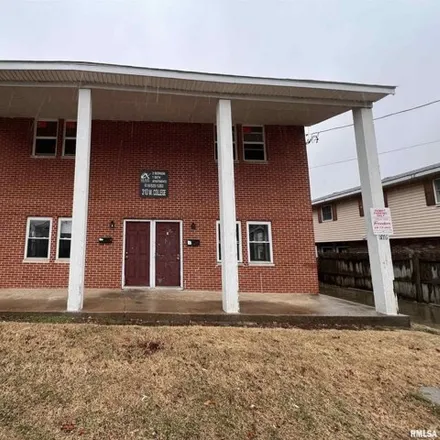
Building is labeled310 W.College. This could be your next project! Home being soldAS-IS.Sellers have started the remodel and would like new owners to finish. All new windows throughout. All units will need new bathrooms put in. Each unit features two...
$91,000
$91,000
Available: Right Now
This property could qualify Buyer could receive up to $5000 at closing, and a $3000 down payment assistance grant from City of Carbondale. This cute as a button 4 bedroom house is located near SIU without being in the middle of college life. Step int...
$75,000
$75,000
Available: Right Now
Calling all investors! This 3 bedroom, 2 bath home has been remodeled with fresh paint, flooring, and carpet and is ready for renters! Not an investor but looking for a good house? This may be what you are looking for. Call today to set up your priva...
$132,500
$132,500
Available: Right Now
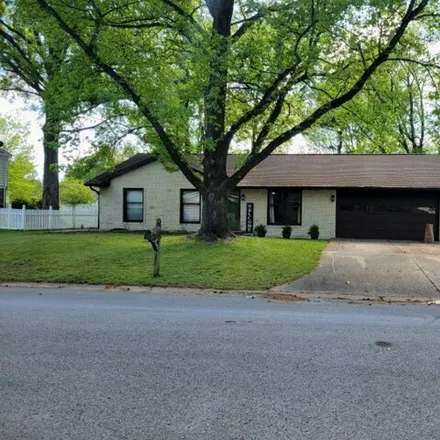
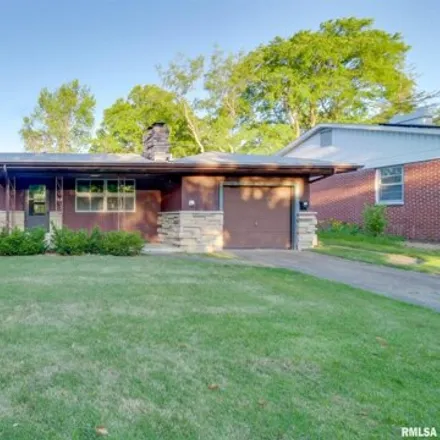
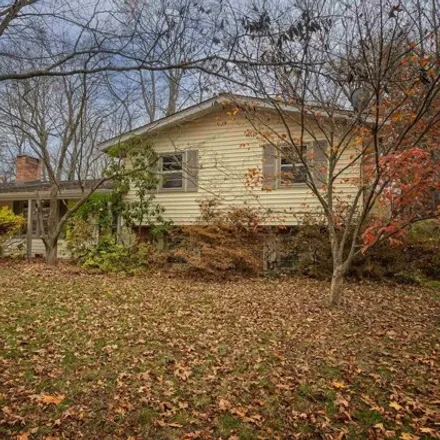
Sellers have freshened up this mid-century 3 bedroom, 1 bath ranch and it is ready for next owner. Updates throughout include new ceiling fans and lighting, new cabinet and door hardware and some electrical updates. Plus, there is newer laminate thro...
$134,900
$134,900
Available: Right Now
$198,000
$198,000
Available: Right Now
Welcome to 128 N Rod Lane! This charming home is now available for sale and offers an ideal opportunity for you to create a warm and inviting home. With 4 bedrooms, 2 baths and a 1 car attached garage, this property provides ample space for your fami...
Carbondale
According to statistics, the population in Carbondale, IL amounts to 26,196, which shows decline 1% compared to the previous year. The median age of the city’s residents is 24. The average household income is $20,873, shifting growth 7% from the past year, and the average property value in Carbondale, IL decline -1% to $117,600 throughout the year.
| Population | 26,196 |
| Median Age | 23.8 |
| Poverty Rate | 45% |
| Household Income | $20,873 |
| Number Of Employees | 11,119 |
| Median Property Value | $117,600 |
Household Income
The average household income in Carbondale, IL grew from $19,515 to $20,873 in the past year. This data is an estimate based upon 10,201 households in Carbondale, IL . The chart below presents how household income is distributed in Carbondale, IL in comparison to the revenue allocation amid households nationally.
Property Value
According to data from last year, the average property value in Carbondale, IL shifted from $119,200 to $117,600 throughout the year. The subsequent graph indicates the share of properties in the given price range in Carbondale, IL in comparison to the median property value in the same price segment across the country. According to the data, the greatest share of Carbondale, IL properties falls in the '$125,000 to $149,999' range, which is lower than the most significant median property across the country.
Rent vs. Own
Property Taxes
One of the most important aspects for property owners is the amount of property taxes. This graph shows distribution of property taxes in Carbondale, IL compared to median property taxes around the country. The prevalent amount of property taxes in Carbondale, IL equals $3000, which is less than the national average.