Castro Valley, CA, USA apartments for sale

$999,000
$999,000
Available: Right Now
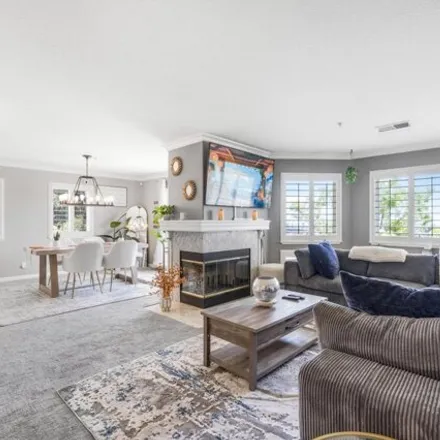
Welcome to your beautifully updated retreat in Castro Valley, CA! This meticulously maintained home boasts an array of recent upgrades, ensuring comfort and convenience. Step inside to discover new appliances including a dishwasher and refrigerator, ...
$685,000
$685,000
Available: Right Now
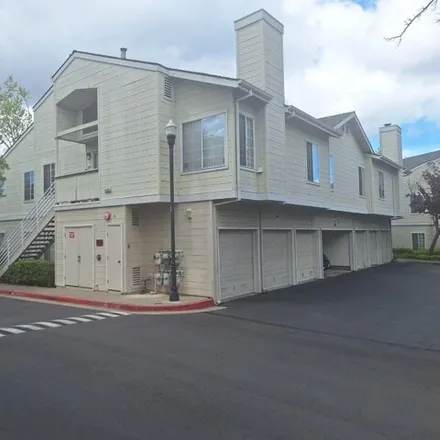
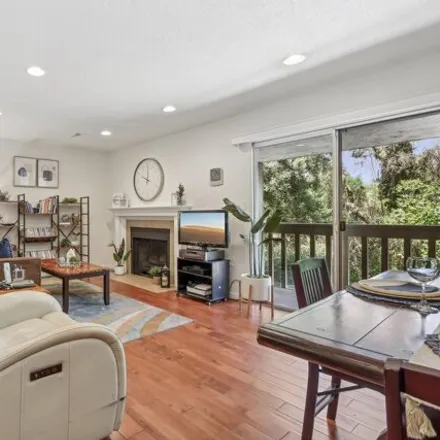
Perched atop N. Hayward in the gated community of Mesa Verde rests this breathtaking 2-bedroom, 2-bath condo w/bonus room. Panoramic views of the Bay and a highly coveted no stairs entry. 1, 393sq.ft of living space boasts dual paned windows and slid...

$999,999
$999,999
Available: Right Now
Nestled in the serene Fairview neighborhood, this charming home offers a perfect blend of comfort and natural beauty. Step inside to discover a bright and airy interior, bathed in natural light streaming through large windows. The inviting living roo...

$1,6M
$1,6M
Available: Right Now
Look no further ! Dream home in the uber-desirable Proctor neighborhood in the coveted CVUSD! Move-in condition, many upgrades including gorgeous Hickory flooring, dual pane windows, decks and more! The home sits on a premium lot with sweeping...

$780,000
$780,000
Available: Right Now
Exceptional living in this beautifully updated single-level 3-bedroom home, perfectly situated in the heart of Hayward. Offering1, 184square feet of thoughtfully designed living space on a generous5, 000square foot lot. Discover a bright, inviting in...
$950,000
$950,000
Available: Right Now
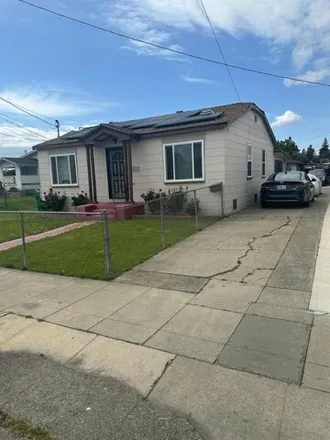
2 houses on one lot ! Front house1, 700sqft, 3bd 1ba, livingroom, fresh interior paint, kitchen plus Bonus room. Rear house, 1030 sqft, it was built in 1967. 2bd 1ba, living room, kitchen + breakfast area. Both houses have their own backyards ...

$900,000
$900,000
Available: Right Now
An excellent duplex across from the Hayward Japanese Gardens that offers a tranquil setting for your tenants. Downstairs unit is 2 bed/1 bath with washer and dryer. Upstairs unit is 1 bed/1 bath with extra large bedroom. Large backyard may allow buil...

$1,39M
$1,39M
Available: Right Now
Welcome to this stunning single-level home, built in 1999, offering1, 754square feet of living space on a spacious6, 632square foot lot. This charming residence features 3 beds, 2 baths, w/ a 2-car garage, situated on a private street just moments aw...

$75,000
$75,000
Available: Right Now
Back on Market, Buyers financing fell through. No fault of Seller! New paint, new appliances, updated touches and more!! This home features two bedrooms, something that is hard to come by in mobiles. Close to dining, shopping, freeways, Bart and ente...
$788,000
$788,000
Available: Right Now
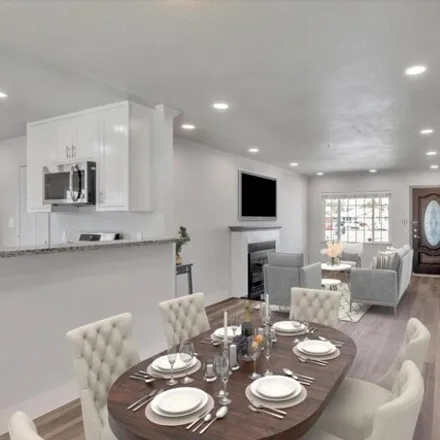
Welcome to 738 Mooney Ave! This beautifully updated single-story home features a new kitchen, renovated bathroom, new flooring, recessed lighting, and fresh paint throughout. Enjoy the spacious backyard for family gatherings, friends' entertainment, ...

$1,39M
$1,39M
Available: Right Now
Nestled in the fairview area of hayward hills, this custom family home captures traditional style and Thoughtful modern upgrades ! Spacious Rooms With Dual Pane Windows Bring An Abundance Of Natural Light Into Every Room. Separate Livin...

$825,000
$825,000
Available: Right Now
Step into this serene townhome in Castro Valley's sought-after Crow Canyon Creek community. This inviting residence embodies tranquility amidst picturesque surroundings of trees, a peaceful creek, and rolling verdant hillsides. Located in the most de...

$1,8M
$1,8M
Available: Right Now
Custom made with 5 inches whole pieces of quality wood over 20 feet long. High ceiling living room, gourmet kitchen and cozy family room. Master bedroom on the top floor with super high ceiling and big attics space for storage. And 3 bedroom 2 full b...

$888,000
$888,000
Available: Right Now
Fully remodeled, beautiful single-family home in the exclusive Hayward Hills! Everything is brand new! Featuring a new composition shingle roof with permits, SPC luxury vinyl flooring, and recessed light fixtures throughout. The kitchen is completely...

$1,15M
$1,15M
Available: Right Now
Lovely home, with split level, open floorplan is located in the hills of San Leandro. Bring your buyers! Upstairs has 3 bedrooms/2 baths including a Spacious owners suite, downstairs has 1 bed/1 bath perfect for guests. Conveniently located near Inte...
$410,000
$410,000
Available: Right Now
Come and experience peace and quiet living at a very affordable price. This unit is easily accessible, located immediately at the entrance to the complex. It consists of 2 bedrooms 1 bath located on the 2nd floor with no downstairs neighbors, inside ...

$949,000
$949,000
Available: Right Now
Outstanding Opportunity! This wonderful 4 bed, 2 bath, 1, 676square foot home located in Hayward would be ideal for you and your family. This beautiful home was built in 1925. Enjoy the distinguished schools associated with this highly desirable home...

$988,000
$988,000
Available: Right Now
Every once in a while a home comes up that gives you everything you need and then a little a bit more to explore your imagination. 20041Anita Ave is this home! This single story detached home offers 3 bedrooms and 1 bath with a floorplan that flows f...

$998,800
$998,800
Available: Right Now
Affordable and Adorable- Nice house on quiet court near Lake and Park! Freshly painted 3 bedroom 1.5 bath house that has nice views and privacy. Great curb appeal. Beautiful remodeled kitchen, quartz countertops, stainless steel appliances is only 2 ...

$785,000
$785,000
Available: Right Now
Discover this spacious corner lot gem spanning over7, 000sq ft. Natural light fills the home, highlighting wood-tone floors and recessed lighting throughout. The inviting living area features a cozy fireplace and seamlessly transitions into the dinin...

$1,69M
$1,69M
Available: Right Now
Spacious Custom House in Upper Valley! Peaceful Location. Large contemporary style 4 bedroom 3.5 bath house, approximately3, 018square feet of living area on low maintenance.23 acre lot. Beautiful kitchen. Cherry wood like cabinets, solid stone count...
$689,888
$689,888
Available: Right Now
Nestled within the vibrant community of Hayward Step into your exquisitely renovated townhome, where every corner exudes sophistication and space. Sink into the plush comfort of the expansive primary bedroom or the equally luxurious second bedroom, o...
Castro Valley
According to statistics, the population in Castro Valley, CA amounts to 63,625, which shows growth 1% compared to the previous year. The median age of the city’s residents is 42. The average household income is $92,233, shifting growth 6% from the past year, and the average property value in Castro Valley, CA growth 7% to $634,600 throughout the year.
| Population | 63,625 |
| Median Age | 41.8 |
| Poverty Rate | 7% |
| Household Income | $92,233 |
| Number Of Employees | 31,956 |
| Median Property Value | $634,600 |
What is the Average Price of Apartments for Sale in Castro Valley, CA?
| Month | Median Price |
|---|---|
| Jun 2024 |
$1,154,582
|
| May 2024 |
$1,084,155
|
| Apr 2024 |
$1,102,966
|
| Mar 2024 |
$1,102,966
|
| Feb 2024 |
$1,102,966
|
| Jan 2024 |
$1,102,966
|
| Month | Median Price |
|---|---|
| Jun 2024 |
$1,190,349
|
| May 2024 |
$1,228,179
|
| Apr 2024 |
$1,192,384
|
| Mar 2024 |
$1,192,384
|
| Feb 2024 |
$1,192,384
|
| Jan 2024 |
$1,192,384
|
Household Income
The average household income in Castro Valley, CA grew from $87,204 to $92,233 in the past year. This data is an estimate based upon 23,046 households in Castro Valley, CA . The chart below presents how household income is distributed in Castro Valley, CA in comparison to the revenue allocation amid households nationally.
Property Value
According to data from last year, the average property value in Castro Valley, CA shifted from $591,600 to $634,600 throughout the year. The subsequent graph indicates the share of properties in the given price range in Castro Valley, CA in comparison to the median property value in the same price segment across the country. According to the data, the greatest share of Castro Valley, CA properties falls in the '$500,000 to $749,999' range, which is higher than the most significant median property across the country.
Rent vs. Own
Property Taxes
One of the most important aspects for property owners is the amount of property taxes. This graph shows distribution of property taxes in Castro Valley, CA compared to median property taxes around the country. The prevalent amount of property taxes in Castro Valley, CA equals $3000, which is less than the national average.