Chandler, AZ, USA apartments for sale

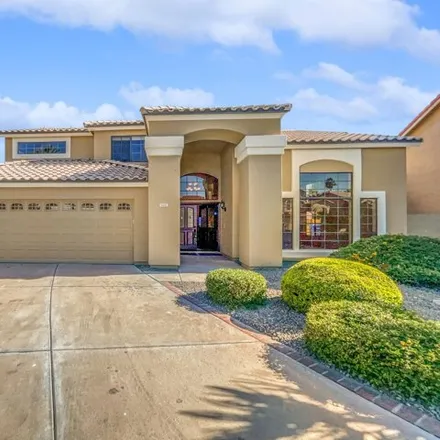
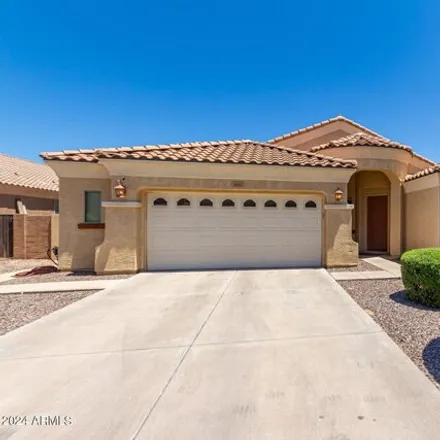
$675,000
$675,000
Available: Right Now
Fantastic location within the popular Chandler community of Kempton Crossing. This beautiful home sits on a larger than average lot with no two story homes overlooking. Recently, this home has undergone significant enhancements that not only increase...
$1,05M
$1,05M
Available: Right Now
Amazing Waterfront Basement home in the beautiful Islands community on a cul da sac lot. Beautiful views of the serene lake. The home boasts vaulted ceilings and a cozy fireplace that overlooks theLAKE ,bright Basement with windows, tra...

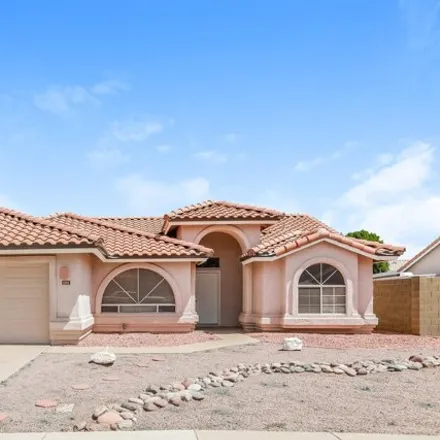
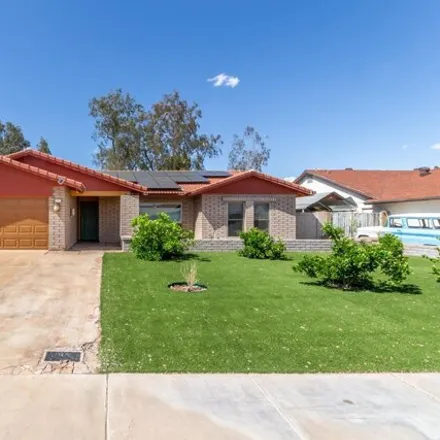
$639,900
$639,900
Available: Right Now
Welcome to your dream home! NO HOA! This inviting 4-bedroom, 2.5-bathroom, two-story gem offers modern comfort and style in every corner. Enjoy cooking in the updated kitchen and relax in the spa-like bathrooms, all thoughtfully renovated to meet you...

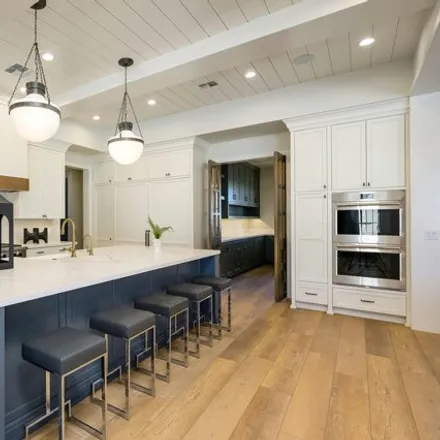
$2,38M
$2,38M
Available: Right Now
Welcome to your dream home in Chandler's Ryan Estates! Step into luxury as you enter this custom home. Every detail is perfection - from the majestic front doors to the wall of vanishing windows showcasing the backyard paradise. This home features 4 ...
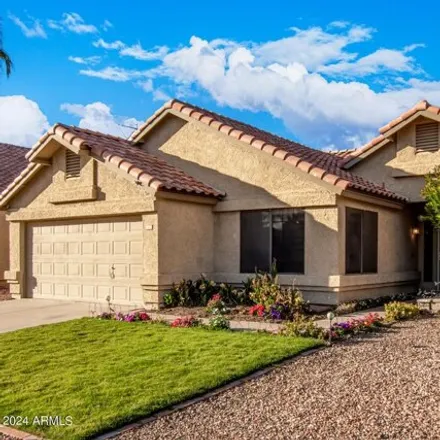
$509,900
$509,900
Available: Right Now
Welcome to your dream home in beautiful Chandler! This inviting 3 bedroom, 2 bath residence offers a perfect blend of comfort and style. Enjoy the ease of no carpet throughout the home, making cleaning a breeze. Each room is equipped with ceiling fan...
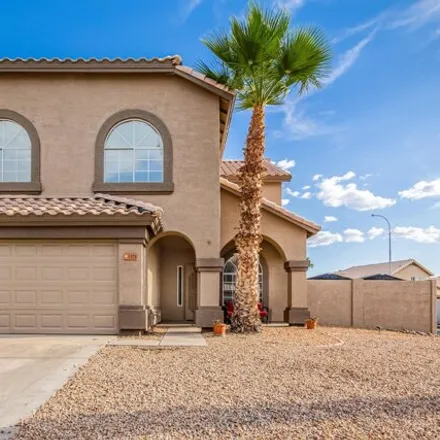
$565,000
$565,000
Available: Right Now
Welcome to your oasis in Chandler, AZ! This charming 4-bedroom, 2.5-bathroom home sits proudly on a corner lot, boasting the rare advantage of no HOA fees. Freshly painted inside and out, the residence exudes a modern allure, while a 2018 roof replac...
$849,950
$849,950
Available: Right Now
Welcome to your next forever home. A corner lot home that is nestled in a coveted cul-de-sac within the Islands Community. This 5 bed, 3 bath, 2 story home has everything you are looking for. This includes curb appeal, fresh exterior paint, 3 car gar...

$674,900
$674,900
Available: Right Now
Who is this ? It's your new home. Your search is Donezo bonanzo. Finding a 4-bedroom house in Chandler; What are the odds ? A welcoming feel is evident the moment you walk in. Built in bookshelves make the front room perfect for ...

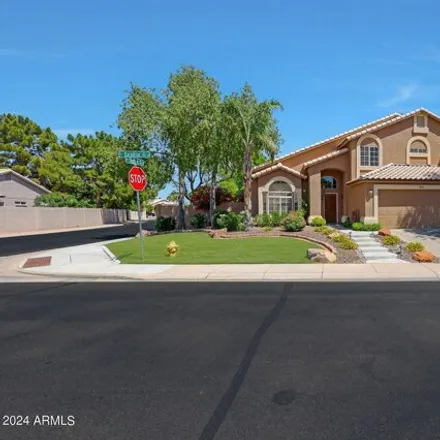
$740,000
$740,000
Available: Right Now
Take a look at this beautiful 2-story home in Rancho del Verde. This 4-bedroom gem displays a 3-car garage and an inviting interior showcasing tile and wood-look floors, tall vaulted ceilings, a neutral palette, and a charming living room. Great room...

$649,900
$649,900
Available: Right Now
Welcome to your new home! This three bedroom, two bathroom home in the coveted neighborhood of Ashley Park is perfect for you and the entire family. Showcasing granite countertops, stainless steel appliances, ample kitchen storage, spacious bedrooms ...

$924,950
$924,950
Available: Right Now
Welcome to Playa Del Rey Recreational Lake Community! This community boast one of the few private water ski/ wakeboard lakes in Gilbert. This home has the latest 24' upgrades including but not limited to NEW Roof-10 year warranty, 2 NEW HVACunits, RE...

$625,000
$625,000
Available: Right Now
Full remodel! Discover the allure of this lovely two-story home, boasting a charming curb appeal with 2-car garage and an inviting front porch. The immaculately designed interior features spacious living areas, excellent for welcoming and entertainin...
$580,000
$580,000
Available: Right Now
The perfect blend of comfort and convenience in this beautifully maintained home nestled in the sought-after Vista Del Oro community of Gilbert! This home is single story, open floor plan and features 3 spacious bedrooms plus a large den, ideal for a...

$389,000
$389,000
Available: Right Now
Impeccable remodeled 2 bedroom, 2 bathroom single level townhome, a true gem. Come inside to find a cozy living room adorned with a fireplace, soaring ceilings, a designer's palette, sliding glass doors that merge indoor and outdoor living. The updat...

$699,000
$699,000
Available: Right Now
Discover your dream home nestled in the popular Canyon Oaks Estates! Featuring a 3-car garage, RV gate, and stone accents. Modern interior showcases clean lines that favor a sleek and functional design paired with tile flooring, soaring vaulted ceili...
$530,000
$530,000
Available: Right Now
This is a rare opportunity to save money on a great Tempe home that needs relatively minor cosmetic work! Priced below comps. This 4 bed, 2 bath home features an upgraded and opened kitchen with dual wall ovens, stainless appliances, new cabinets, an...
$3,58M
$3,58M
Available: Right Now
Never lived in - move in ready new construction custom home ! Built for owners, not as a spec. The sellers put so much love into designing this home alongside their Alisha taylor interior design team. Enjoy 2 kitchens and wet bar...

$699,900
$699,900
Available: Right Now
Experience tranquility in this stunning home backing up to a serene community park-no rear neighbors. Charming front porch and eye-catching custom iron front screen door welcome you in style. This home has been loved and well cared for. 5 bedroom + d...
$490,000
$490,000
Available: Right Now
This gilbert gem is a must see ! Move in ready with a split floor plan, 3 beds, 2 full baths, Primary bedroom has brand new flooring, huge family room with cozy fireplace, dining, laundry room with fairly new high end washer and dryer Inclu...

$975,000
$975,000
Available: Right Now
Stunning Dream Home Featuring 4 Bed, 2.5 Bath+Den/Office, 3 Car Garage Nestled on 1/3 Acre Lot w/ a Luxurious Private Backyard Oasis In One of the Most Desirable All Single Level Gated Communities in South Chandler. Enjoy the Exquisite Open Floor Pla...
$769,000
$769,000
Available: Right Now
You are so lucky! You are in the right place at the right time to purchase this home - not only does it look pretty with it's 4 bedrooms, 2 baths and HUGE pantry, brand new floors, new hvac last year and new gas furnaces as well, new water heater and...

$430,000
$430,000
Available: Right Now
Become the proud owner of this charming 3-bedroom, 2.5-bath residence in Seawynds! The living room showcases soaring vaulted ceilings, natural light, blinds for privacy and stylish wood-look flooring. The AC is one year old and the Water Heater is Le...
Chandler
According to statistics, the population in Chandler, AZ amounts to 245,160, which shows growth 1% compared to the previous year. The median age of the city’s residents is 35. The average household income is $77,278, shifting growth 4% from the past year, and the average property value in Chandler, AZ growth 8% to $268,000 throughout the year.
| Population | 245,160 |
| Median Age | 35.3 |
| Poverty Rate | 9% |
| Household Income | $77,278 |
| Number Of Employees | 128,734 |
| Median Property Value | $268,000 |
What is the Average Price of Apartments for Sale in Chandler, AZ?
The average sale price for apartment in Chandler, AZ: $413,600
(+80.3%)
| Month | Median Price |
|---|---|
| Jun 2024 |
$370,921
|
| May 2024 |
$390,465
|
| Apr 2024 |
$397,103
|
| Mar 2024 |
$397,103
|
| Feb 2024 |
$397,103
|
| Jan 2024 |
$397,103
|
| Month | Median Price |
|---|---|
| Jun 2024 |
$413,600
|
| May 2024 |
$229,449
|
| Apr 2024 |
$278,078
|
| Mar 2024 |
$278,078
|
| Feb 2024 |
$278,078
|
| Jan 2024 |
$278,078
|
Household Income
The average household income in Chandler, AZ grew from $74,329 to $77,278 in the past year. This data is an estimate based upon 87,286 households in Chandler, AZ . The chart below presents how household income is distributed in Chandler, AZ in comparison to the revenue allocation amid households nationally.
Property Value
According to data from last year, the average property value in Chandler, AZ shifted from $248,500 to $268,000 throughout the year. The subsequent graph indicates the share of properties in the given price range in Chandler, AZ in comparison to the median property value in the same price segment across the country. According to the data, the greatest share of Chandler, AZ properties falls in the '$300,000 to $399,999' range, which is higher than the most significant median property across the country.
Rent vs. Own
Property Taxes
One of the most important aspects for property owners is the amount of property taxes. This graph shows distribution of property taxes in Chandler, AZ compared to median property taxes around the country. The prevalent amount of property taxes in Chandler, AZ equals $1150, which is less than the national average.