Chatham, IL, USA apartments for sale

$479,900
$479,900
Available: Right Now
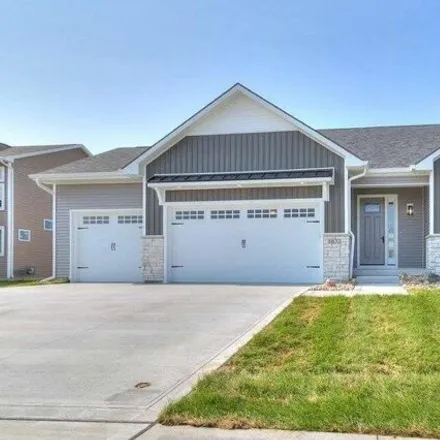
Completed in late 2015 in the highly desired Manor Hill subdivision of Chatham, this exquisite4BR/3BAranch sits beautifully w/lush landscapes and classic curb appeal. Step inside to soaring ceilings, expansive windows and loads of intricate, classic ...
$399,000
$399,000
Available: Right Now
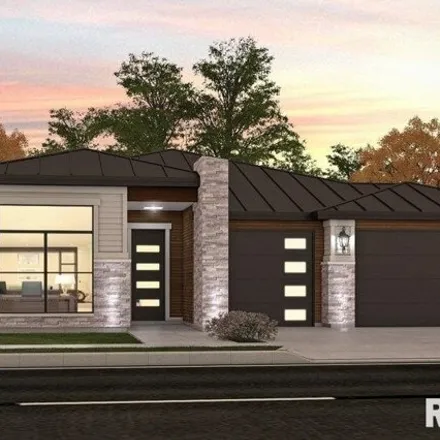
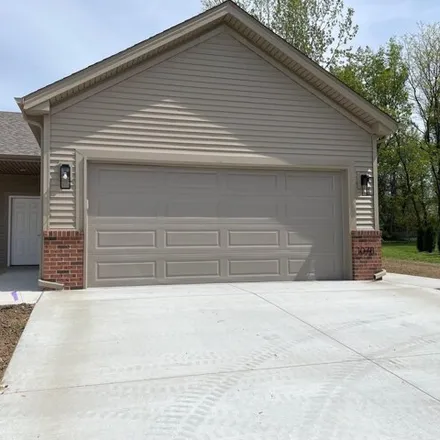
This Energy efficient modern ranch farmhouse includes walk-in closets and a bathroom accessible from the hallway. We can build this home with an optional 3rd car garage, adding to its functionality and appeal. Custom built landing zone. High end Gara...
$539,000
$539,000
Available: Right Now
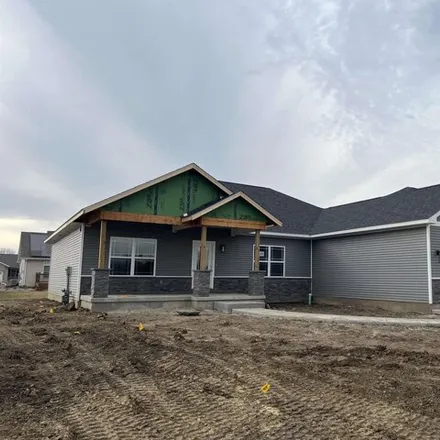
Coming soon - No Showings -construction starts march2024 -Prairie Style with a modern exterior 2189 sq foot 3-bedroom 3 car garage. This home has Black roof, Black Soffit and Fasia, black windows, oversized LED lighting on the garage and front porch....
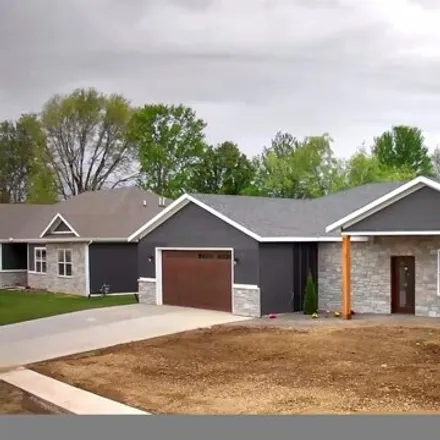
$495,900
$495,900
Available: Right Now
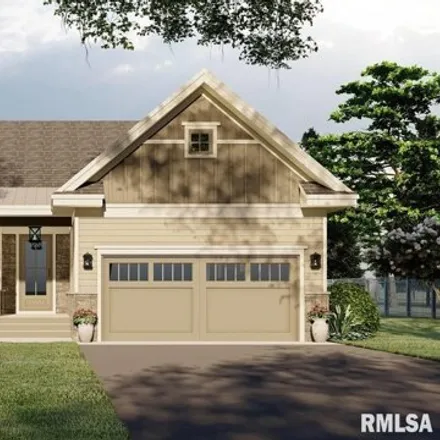
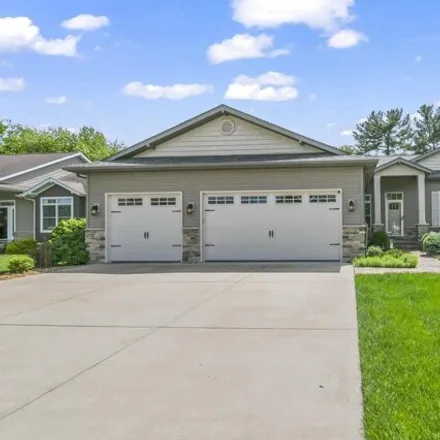
If you are looking for your dream home, look no further! This flawless brand new construction home is in a new phase of Manor Hill II. It sits on a large level lot on a brand new street. This fantastic floor plan offers 4 bedrooms with a split bedroo...
$489,000
$489,000
Available: Right Now
Framed up, completion soon. High efficiency new construction home. This is not your average home. This home is built like a you would construct it yourself. Constructed with The Best in Building Materials, Advantek Flooring, Zip system walls and Roof...

$449,000
$449,000
Available: Right Now
Coming soon ! Showings begin June 29 and will continue thru July 1st. Dont miss this gorgeous and meticulously maintained 4-year-old home with 5bd/3.5ba in popular Manor Hill 2 (Chatham). Great floorplan w/4 bedrooms up w/laundry upstairs too....

$269,500
$269,500
Available: Right Now
Coming soon! Come take a look at this well-maintained 3 bedroom, 2 bath, ranch which sits on almost 1/2 an acre in a quiet and attractive neighborhood in Glenarm , chatham school district. Same owners for last 22 years. Sellers say neighbors a...

$439,900
$439,900
Available: Right Now
Wide open 1.5 story plan with with a living room, kitchen, and dining area all open to one another for convenience. The eat-in kitchen is well laid out with it's center island breakfast bar, stainless appliances, and corner pantry. The main floor pri...

$875,000
$875,000
Available: Right Now
Stunning...just stunning. Very few like this one...2 acres, in-ground salt-water pool, and over 35 years of care with several iterations of remodels. Exceptionally well maintained and fine-tuned. Incredible outdoor living area with cedar deck, pool (...
$465,000
$465,000
Available: Right Now
This is Not your normal New Construction home. This is an ICF (insulated concrete form home) This home has 2 inches foam on the exterior of the wall, 6 inches of solid re-enforced concrete and 2 inches of foam in the interior of the home. Constructed...
$249,500
$249,500
Available: Right Now
New Construction Ranch Duplex Condo! Open Floor plan from the kitchen through the living room. Deer Ridge condos give you the best of everything! Convenient location in Chatham. Near schools, shopping and restaurants. This duplex is also a true condo...

$250,000
$250,000
Available: Right Now
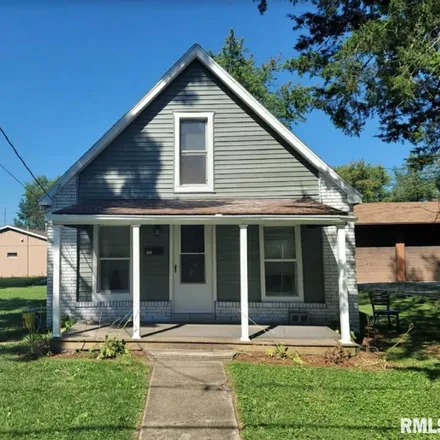
Discover this charming two story home in the heart of Chatham IL. 3 bedrooms and 2 full bathrooms. Boasting recent updated and nestled in a top-rated school district, this property is perfect for families seeking both comfort and convenience. Don't m...

$235,000
$235,000
Available: Right Now
Perfect 2 bed/2 bath attached home featuring open floorplan and spacious backyard. You will love the vaulted ceiling in the living and dining area. New roof in2023, HVACand water heater in 2014. Fireplace works, but seller has it capped off. Selling ...
$420,000
$420,000
Available: Right Now
Apartment for sale in/on/near 2280 East Walnut Road, Springfield Lake Shore, Chatham. The price for this apartment is $420,000. This 3398-square-feet 3 bedroom apartment features 4 bathroom. Contact the agent to schedule an open house....
$359,000
$359,000
Available: Right Now
Apartment for sale in/on/near 905 Deerfield Road, Springfield Lake Shore, Chatham. The price for this apartment is $359,000. This 2164-square-feet 3 bedroom apartment features 2 bathroom. Contact the agent to schedule an open house....

$159,900
$159,900
Available: Right Now
Coming soon- no showings until saturday june 15th ! Welcome to 207 S State in the heart of Chatham. This home has been meticulously updated and features a new fence installed in 2022, enclosing a large yard. Inside, you'll find trendy updates,...

$184,900
$184,900
Available: Right Now
Don't miss out on this one! Beautifully maintained 2-bedroom 2 full bath duplex. Inside you will find an open floor plan with vaulted ceilings in living room, dining area and kitchen. Built in entertainment center in living room. The master suite has...
$519,900
$519,900
Available: Right Now
Step into elegance and comfort with this meticulously cared for Craftsman style ranch home. Boasting breathtaking landscaping that envelopes the property. Indulge in spacious luxury with this 5 bedrooms and 3.5 bath home with an open and split floor ...

$369,999
$369,999
Available: Right Now
Coming soon !! No showings until6/19/24.This super spacious Chatham 2story has so much to offer for the price! You are sure to be wowed the moment you arrive, as the exterior of the home has had a complete facelift! 2023 blessed this home w/ a...

$389,900
$389,900
Available: Right Now
It's time to make memories. Come and see this beautiful 4 bedroom home with a built-in swimming pool in Chatham schools. Open plan and lots of natural light. The basement is partially finished and ready to have that 5th bedroom and full bath to round...
$82,500
$82,500
Available: Right Now
Check out this completely remodeled, yet affordable, 2 bed, 1 bath home in Chatham. Generous updates including, but not limited to new flooring, windows, fresh paint, fully remodeled bathroom, kitchen, living room and bedrooms. Upstairs has a bonus r...

$495,000
$495,000
Available: Right Now
Gorgeous inside 2023 custom built Craftsman style Ranch in popular Hurstbourne Subdivision! Enjoy a sprawling open floorplan with high end finishings and family living space galore! Fabulous kitchen w/quartz counters, crisp white cabinets, island, pa...
$179,900
$179,900
Available: Right Now
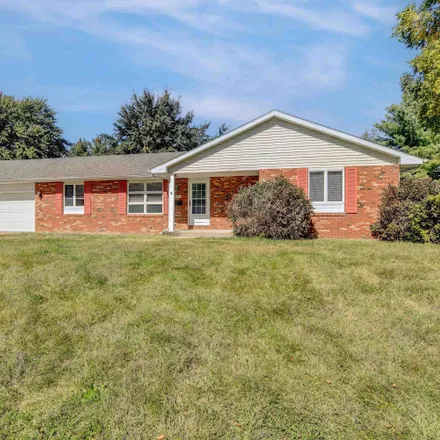
Don't miss out on this brick ranch in Chatham. This home offers 3 bedrooms, 2 baths along with 2 separate living areas and a large fenced in backyard. Enjoy time warming up in the family room with gas log fireplace. The bathrooms have been updated, s...
$250,000
$250,000
Available: Right Now
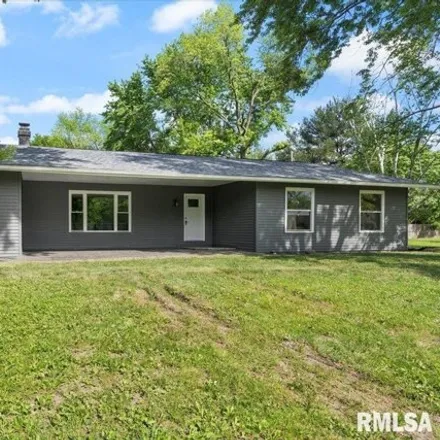
Beautiful Ranch style home situated in Walnut Park Estates Subdivision. Completely renovated inside and out in 2024! Enjoy low maintenance living with everything on one level and sleek modern updates throughout! Home features a spacious living room w...

$265,000
$265,000
Available: Right Now
Coming Soon: This lovely home in Oakbrook Estates in Chatham is located close to everything you need, including Lake Springfield, Apple Barn nursery, a pharmacy, bank, grocery store, Dr. offices, restaurants, gas stations, internet access and only 10...
Chatham
According to statistics, the population in Chatham, IL amounts to 12,749, which shows growth 1% compared to the previous year. The median age of the city’s residents is 36. The average household income is $81,402, shifting decline 1% from the past year, and the average property value in Chatham, IL growth 3% to $185,100 throughout the year.
| Population | 12,749 |
| Median Age | 35.5 |
| Poverty Rate | 4% |
| Household Income | $81,402 |
| Number Of Employees | 6,717 |
| Median Property Value | $185,100 |
What is the Average Price of Apartments for Sale in Chatham, IL?
| Month | Median Price |
|---|---|
| Jun 2024 |
$1,341,075
|
| May 2024 |
$1,093,904
|
| Apr 2024 |
$1,277,463
|
| Mar 2024 |
$1,277,463
|
| Feb 2024 |
$1,277,463
|
| Jan 2024 |
$1,277,463
|
| Month | Median Price |
|---|---|
| Jun 2024 |
$1,269,304
|
| May 2024 |
$1,462,865
|
| Apr 2024 |
$1,197,980
|
| Mar 2024 |
$1,197,980
|
| Feb 2024 |
$1,197,980
|
| Jan 2024 |
$1,197,980
|
Household Income
The average household income in Chatham, IL grew from $80,808 to $81,402 in the past year. This data is an estimate based upon 4,721 households in Chatham, IL . The chart below presents how household income is distributed in Chatham, IL in comparison to the revenue allocation amid households nationally.
Property Value
According to data from last year, the average property value in Chatham, IL shifted from $178,900 to $185,100 throughout the year. The subsequent graph indicates the share of properties in the given price range in Chatham, IL in comparison to the median property value in the same price segment across the country. According to the data, the greatest share of Chatham, IL properties falls in the '$200,000 to $249,999' range, which is lower than the most significant median property across the country.
Rent vs. Own
Property Taxes
One of the most important aspects for property owners is the amount of property taxes. This graph shows distribution of property taxes in Chatham, IL compared to median property taxes around the country. The prevalent amount of property taxes in Chatham, IL equals $3000, which is less than the national average.