Chatham, MA, USA apartments for sale
$829,000
$829,000
Available: Right Now
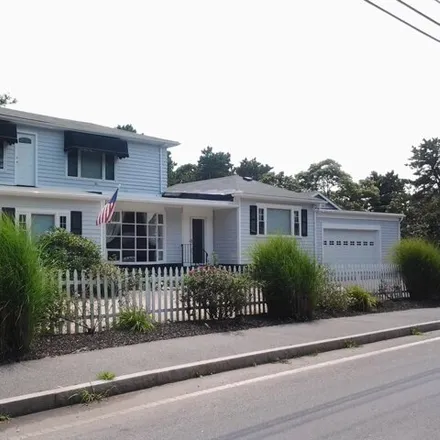
Love East Harwich. This spacious home is convenient to everywhere you want to be shopping, beaches, hop and a skip to Chatham. Three bedrooms and two full baths and the ability to expand. The backyard has a hot tub and a fenced in yard for dogs. If y...
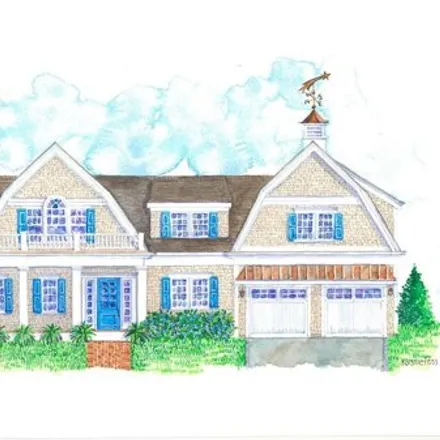
$4,9M
$4,9M
Available: Right Now
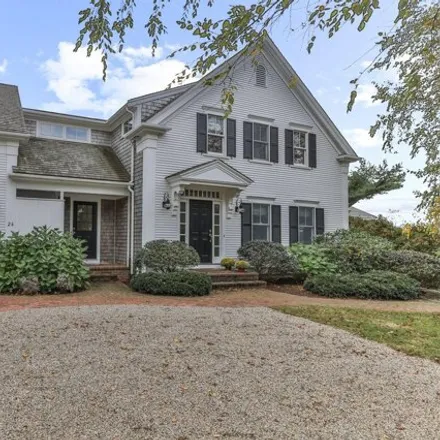
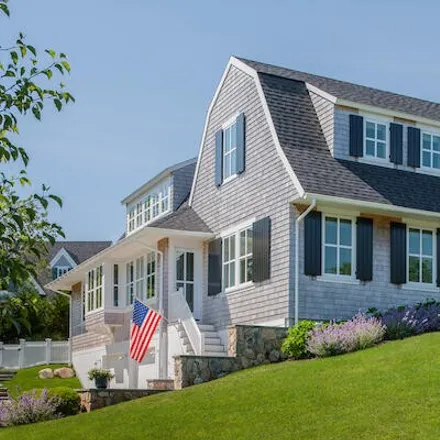
Welcome to 67 Uncle Alberts Drive, a charming Cape Cod home nestled in the picturesque town of Chatham, MA. This outstanding property offers a perfect blend of classic Cape Cod architecture and modern design. The design is perfect for entertaining wi...
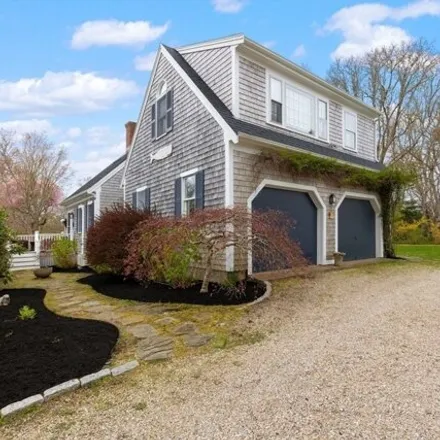
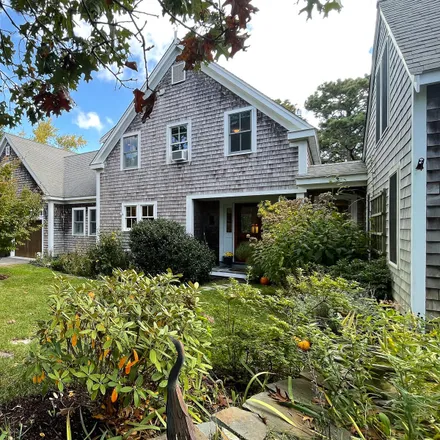
$1,98M
$1,98M
Available: Right Now
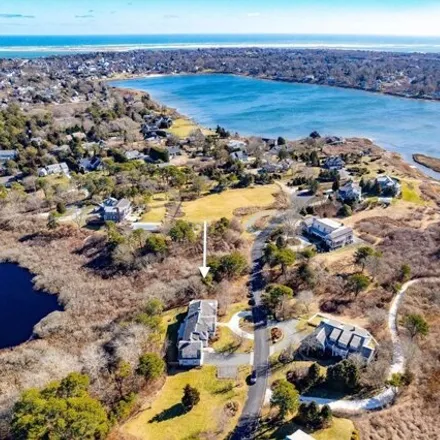
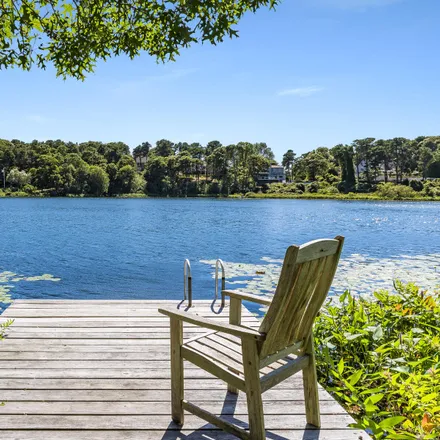
First time offered in 30 years! Lovely Cape on the Loop and close to downtown. Boaters dream, includes deeded access to Oyster Pond and a mooring field via a private neighborhood path providing ideal boating access to Stage Harbor, Nantucket Sound an...
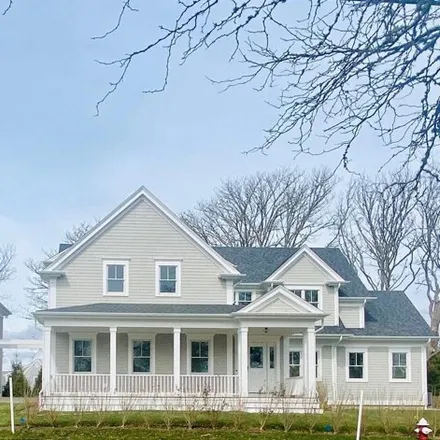
$4M
$4M
Available: Right Now
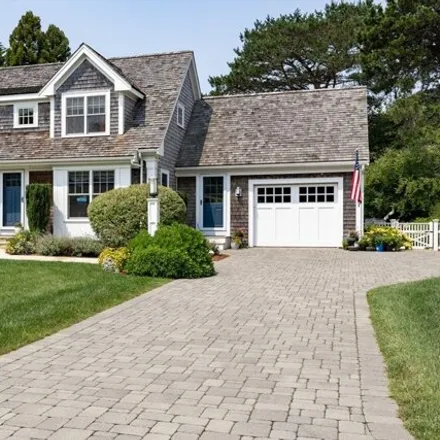
In-town Chatham, 2018 custom-built home on a quiet cul-de-sac just a short stroll to village shops, restaurants, and Angler's baseball. This3 BR, 4/1Baths, 4, 100sf home is full of thoughtful upgrades including black walnut hardwood floors, office, 3...
$1,8M
$1,8M
Available: Right Now
$4,75M
$4,75M
Available: Right Now
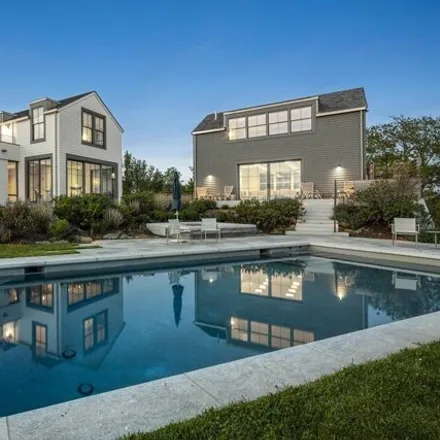
Affording coastal luxury and quality of design, this new construction residence takes advantage of an exceptional location along '' the Chatham loop'' and is also moments to the Village and Oyster Pond Beach. Meticulous choice of finishes combined wi...
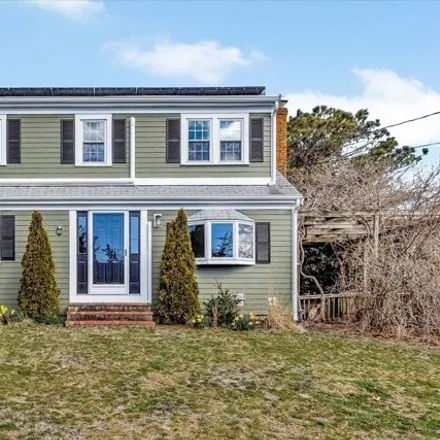
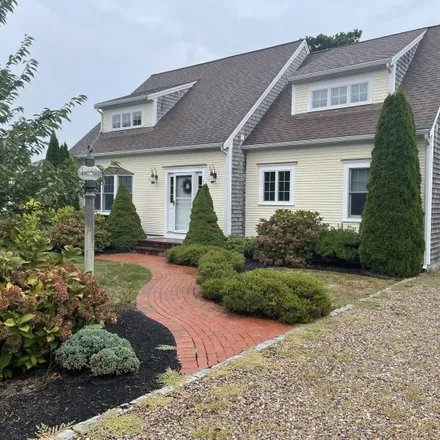
$875,000
$875,000
Available: Right Now
Available for the first time in 50 years, this lovingly maintained 4 bedroom 2 bath home is a blend of a traditional Cape style home with a contemporary flair surrounded by established trees and thoughtful, mature plantings. There have been many pers...
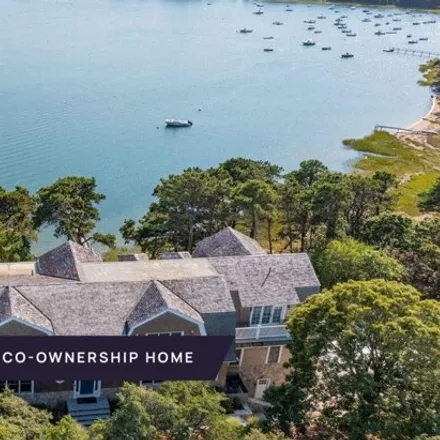
$1,57M
$1,57M
Available: Right Now
New co-ownership opportunity: Own one-eighth of this turnkey home, professionally managed by Pacaso. Set on 2.74 acres, Fox Hill offers a private sanctuary with11, 000square feet of sophisticated coastal luxury. The renovated retreat has stunning vie...
$1,5M
$1,5M
Available: Right Now

$7M
$7M
Available: Right Now
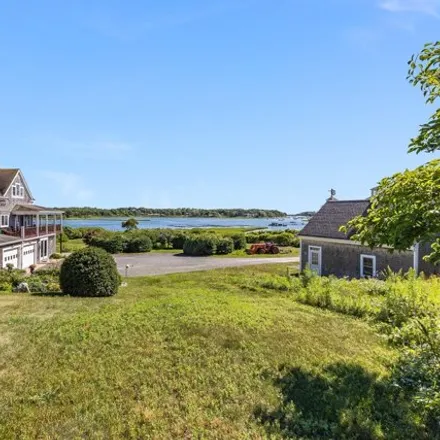
A captivating coastal gem, nestled on the crest of Stage Island and surrounded by the scenic waters of Nantucket Sound, this picturesque setting offers a serene and idyllic backdrop for nature enthusiasts and beachgoers alike. This one of a kind priv...
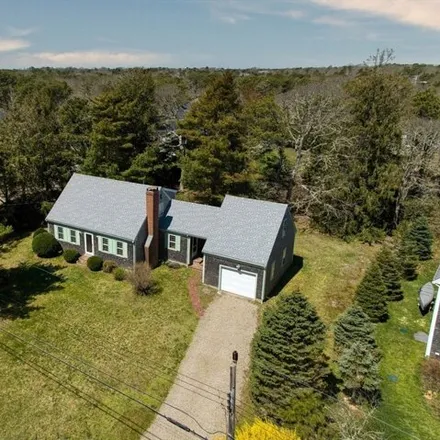
$1,05M
$1,05M
Available: Right Now
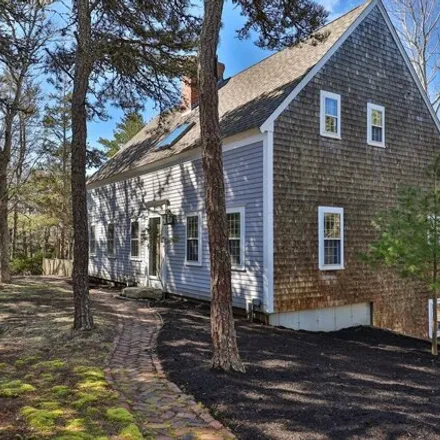
Don't miss out on this classic cape-style home nestled in the heart of Chatham! Boasting a rare 4-bedroom, 2-bath layout, it offers spacious living for all. Revel in the elegance of brand new seamless hardwood oak flooring throughout, while the new r...
$4,2M
$4,2M
Available: Right Now
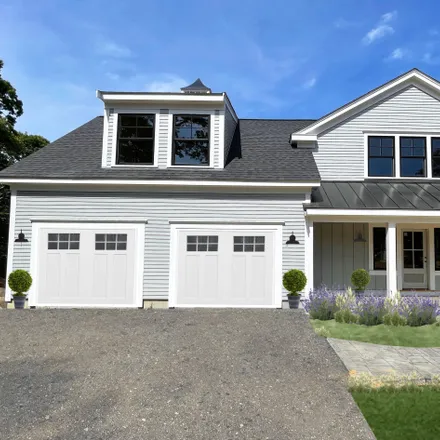
Chatham, MA - Brand new construction. This dramatic Dutch Gambrel style home features over4, 200square feet of living space on 3 levels. With 4 bedrooms and 5.5 baths, this remarkable residence presents a balanced mix of elegant and casual living are...
$1,7M
$1,7M
Available: Right Now
Welcome to this exciting and special property! Dramatic night-lit hardscaping and thoughtful plantings encompass a light and bright home with peaceful conservation views and privacy. On the coveted ''LOOP'' location, sidewalks will take you to the vi...
$12,8M
$12,8M
Available: Right Now
Absolute perfection at this stunning in-town compound featuring commanding water views over Oyster Pond! The result of a multi-year collaboration by top architects, designers and builders, this sophisticated and turn-key coastal offering seamlessly b...
$3,25M
$3,25M
Available: Right Now
Nestled right in the heart of Chatham Village, this four bedroom five and half bath residence exudes charm and a perfect Cape Cod lifestyle with all of Chatham's restaurants, boutiques and Oyster Pond Beach moments away. The home is characterized by ...
$2,7M
$2,7M
Available: Right Now
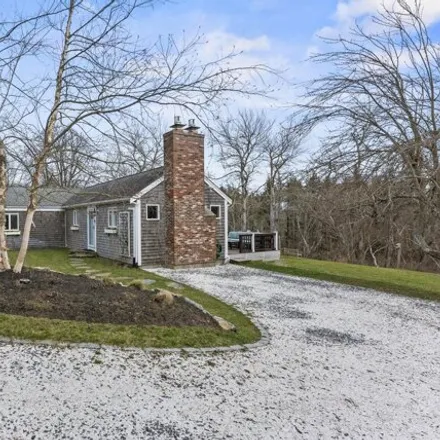
$1,3M
$1,3M
Available: Right Now
A beautiful display of wood in this Post and Beam style home which includes 3 bedrooms, 2.5 baths. Originally designed and built by its' owner with emphasis on detail. A significant plus is the 844 sq. ft. in the basement with along with lots of stor...
$3,3M
$3,3M
Available: Right Now
$8,5M
$8,5M
Available: Right Now
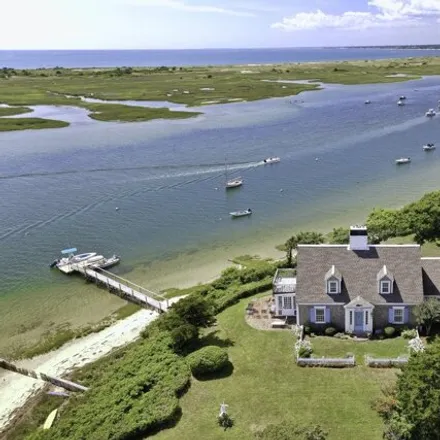
Overlooking the iconic Stage Harbor Lighthouse, this picturesque property is unrivaled with over 200 feet of beachfront, a deep water dock, and ever changing views of Oyster River, Nantucket Sound, Stage Harbor and the Atlantic beyond. Boaters will r...
$1,9M
$1,9M
Available: Right Now
$5,5M
$5,5M
Available: Right Now
Tucked away in a very private setting in Chatham, this historic 1.4 acre Waterfront estate property offers a blend of luxury and legacy. Previously part of Chatham Bars Inn's farm, it's been in one family for more than 70 years, promising a serene co...
$6,9M
$6,9M
Available: Right Now
Overlooking beautiful Crows Pond, this exquisite property has a myriad of opportunities with a six bedroom septic, conceptual building plans for a four bedroom main house and an existing two bedroom, two bath waterfront home that feels like a private...
Chatham
According to statistics, the population in Chatham, MA amounts to 1,373, which shows decline -4% compared to the previous year. The median age of the city’s residents is 60. The average household income is $58,015, shifting growth 7% from the past year, and the average property value in Chatham, MA decline 0% to $690,300 throughout the year.
| Population | 1,373 |
| Median Age | 60.2 |
| Poverty Rate | 13% |
| Household Income | $58,015 |
| Number Of Employees | 561 |
| Median Property Value | $690,300 |
What is the Average Price of Apartments for Sale in Chatham, MA?
| Month | Median Price |
|---|---|
| Apr 2024 |
$1,277,463
|
| Mar 2024 |
$1,277,463
|
| Feb 2024 |
$1,277,463
|
| Jan 2024 |
$1,277,463
|
| Dec 2023 |
$668,627
|
| Nov 2023 |
$515,563
|
| Month | Median Price |
|---|---|
| Apr 2024 |
$1,197,980
|
| Mar 2024 |
$1,197,980
|
| Feb 2024 |
$1,197,980
|
| Jan 2024 |
$1,197,980
|
| Dec 2023 |
$675,850
|
| Nov 2023 |
$794,783
|
Household Income
The average household income in Chatham, MA grew from $54,063 to $58,015 in the past year. This data is an estimate based upon 719 households in Chatham, MA . The chart below presents how household income is distributed in Chatham, MA in comparison to the revenue allocation amid households nationally.
Property Value
According to data from last year, the average property value in Chatham, MA shifted from $687,500 to $690,300 throughout the year. The subsequent graph indicates the share of properties in the given price range in Chatham, MA in comparison to the median property value in the same price segment across the country. According to the data, the greatest share of Chatham, MA properties falls in the '$500,000 to $749,999' range, which is higher than the most significant median property across the country.
Rent vs. Own
Property Taxes
One of the most important aspects for property owners is the amount of property taxes. This graph shows distribution of property taxes in Chatham, MA compared to median property taxes around the country. The prevalent amount of property taxes in Chatham, MA equals $3000, which is less than the national average.