Chesterfield, MO, USA apartments for sale
$969,000
$969,000
Available: Right Now
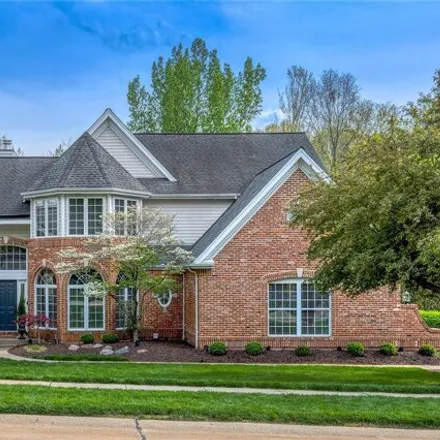
Beautifully updated brick 1.5-sty in prestigious Wildhorse. Impressive hardwood foyer leads to formal dining room with Palladian windows and vaulted great room with floor-to-ceiling stacked stone fireplace flanked by built-in bookcases and dramatic w...
$780,000
$780,000
Available: Right Now
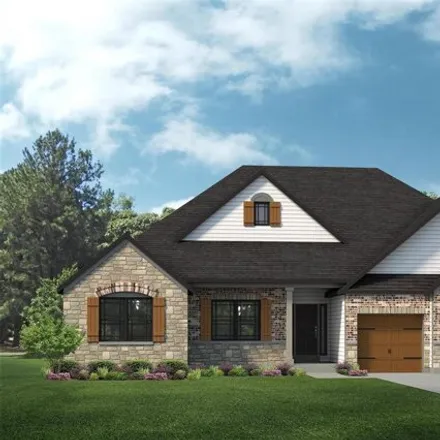
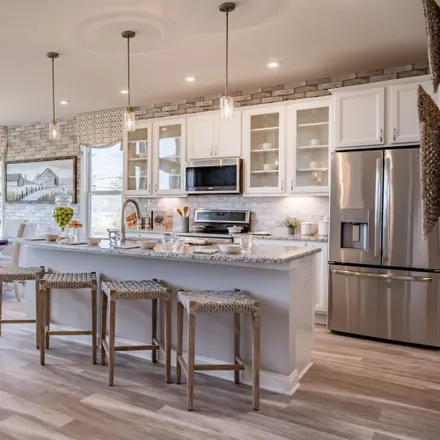
Great location! Welcome to The Legends at Schoettler Pointe by Lombardo Homes. The Savannah is a ranch home with 4 bedrooms, 2.5 bathrooms, and more than2, 600sq. ft. of living space. Interior features include a study off the great room, which then o...
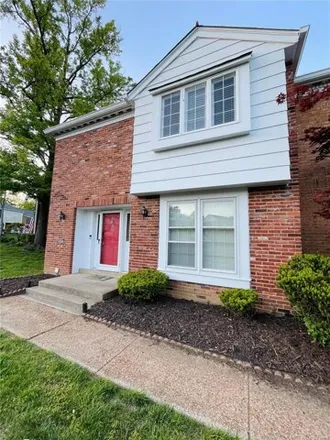
$364,900
$364,900
Available: Right Now
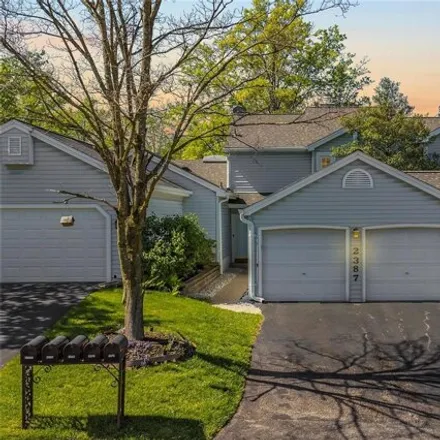
Welcome to 14976 Manor Lake Dr, a beautiful 3 Bed, 2.5 Bath, Townhome in the Manors of Broadmoor! Inviting Entry opens to the Great Room, featuring a gas fireplace with brick surround and mantle. Separate Dining Room, overlooks the Lower Level, is op...
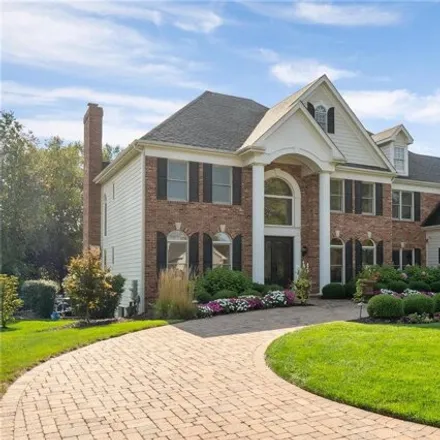
$840,000
$840,000
Available: Right Now
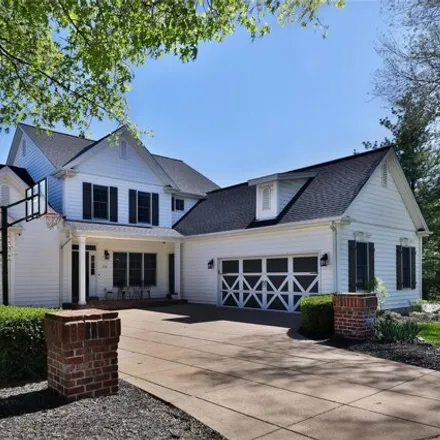
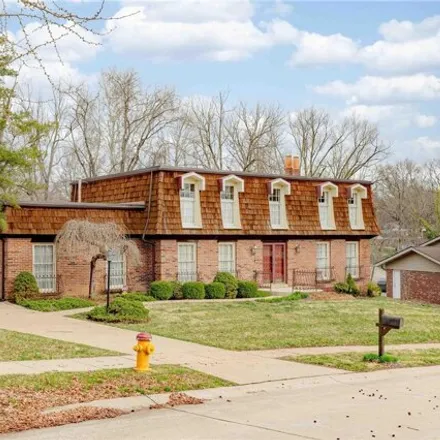
Spectacular 5-bedroom home located in a private Chesterfield enclave of custom-built homes. Exceptional design details include hardwood floors, large, sparkling windows and extensive millwork. The 2-story foyer leads to a formal dining room and a gre...
$750,000
$750,000
Available: Right Now
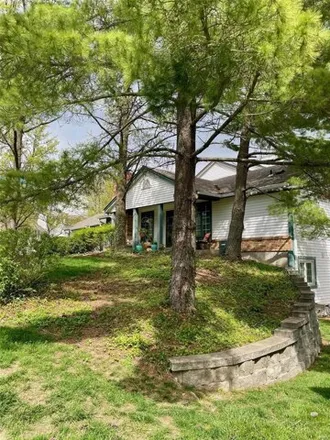
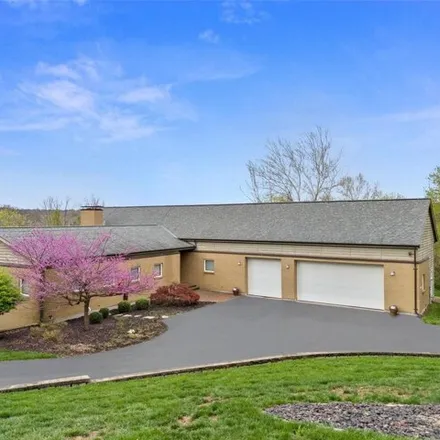
Meticulous ranch that sits on over 2.5 acres with breaktaking views from all rooms. Custom home built with acres of trees and beautiful landscape. Gorgeous solid oak hardwood floors on main floor. 11 ft and 9ft ceilings on main level. Very open feel ...
$689,000
$689,000
Available: Right Now
Chesterfield Villa living is at its finest in the desirable Baywood Villages. 313 Morristown is one of the largest floor plans with approximately 3100 sqft plus a finished lower level. Greeted by a dramatic great room off the foyer with 2 story ceili...
$599,000
$599,000
Available: Right Now
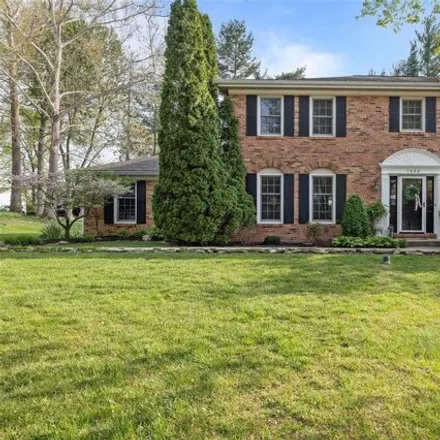
You've waited for the home you really want to LOVE. Well, here it is! After you take in the gorgeous curb appeal, step inside and see custom details everywhere you turn. Wainscotting, chair rails, and crown molding accent the main floor rooms effortl...
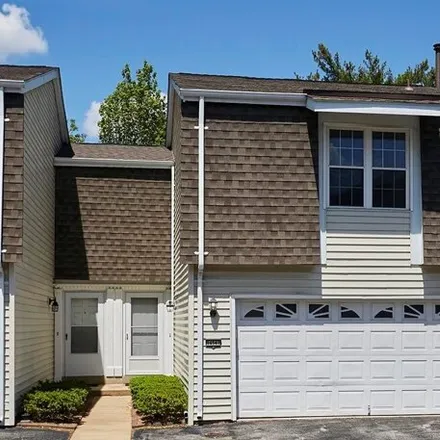
$727,900
$727,900
Available: Right Now
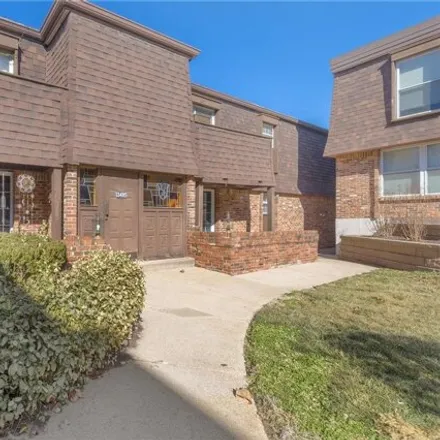
$350,000
$350,000
Available: Right Now
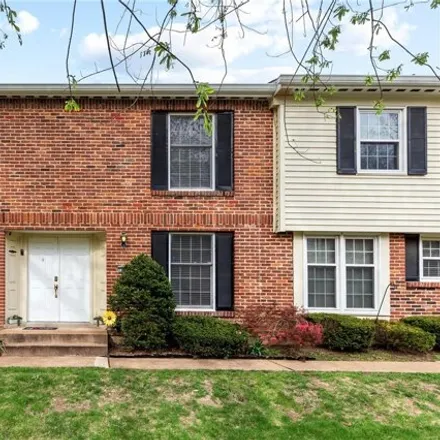
Spacious 3 bed, 3.5 townhome in the heart of Chesterfield! The main level includes a spacious living room, large eat-in kitchen, formal dining room, and powder room. Both the living room and the kitchen open to the rear low-maintenance deck! Upstairs...
$725,000
$725,000
Available: Right Now
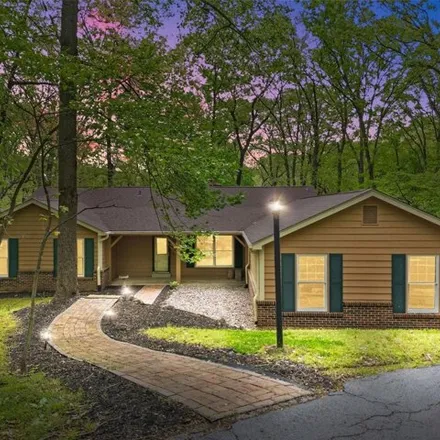
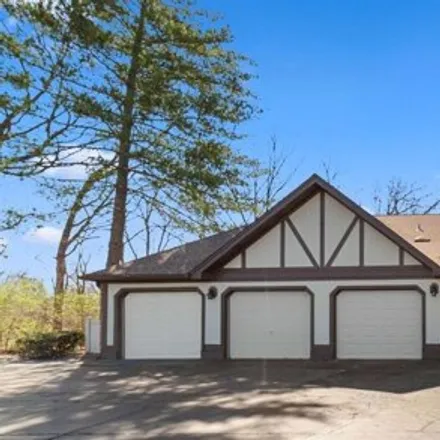
Welcome to your secluded oasis nestled on 3.4 acres of pristine woodland! This stunning ranch-style home boasts 4 bedrooms and 3 1/2baths, offering spacious and comfortable living. Step inside to discover the amazing view from the family room windows...
$695,000
$695,000
Available: Right Now
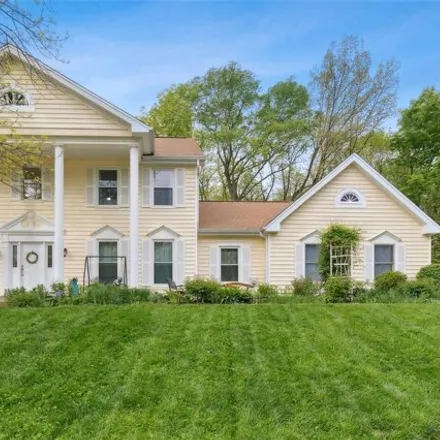
Make this home your own slice of paradise! Beautiful4 BR 3 BAsanctuary is the perfect blend of luxury and comfort. Easy care bamboo flooring, rooms bathed in natural light, skylights, and large windows throughout the home create a warm and inviting a...
$315,000
$315,000
Available: Right Now
Welcome to your dream condo nestled in the sought-after Gardens at Broadmoor community! Step into updates with new LVP flooring, completely remodeled kitchen boasting sleek granite countertops, brand new appliances, and stylish cabinets complemented ...
$244,500
$244,500
Available: Right Now
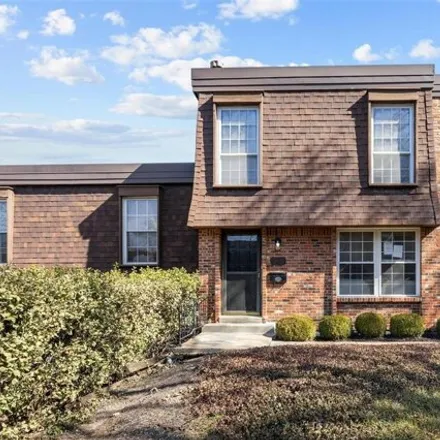
Check it out! This Chesterfield townhouse is getting prepped for pro photos!! This 3 bed 3 bath 2 story gem is almost ready to rock!! Located in the Woodlake Condos, this move in ready home with IT'S OWN tuck under garage will be a must see!!! Pro ph...
$1,8M
$1,8M
Available: Right Now
Immaculate and stately residence exudes sophistication and elegance at every turn. Boasting a crisp, clean, and stylish design, this home is a true testament to luxury living. Grand two-story entry greets you with an abundance of natural light pourin...
$155,000
$155,000
Available: Right Now
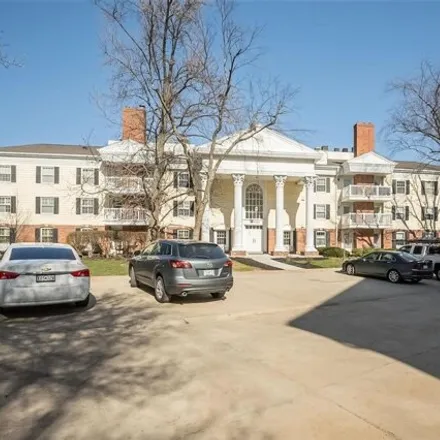
Welcome to 13485 Coliseum Dr Unit #G. This charming 2 bed, 2 bath, Chesterfield Condo is an absolute must see! Located in Parkway Central District and close proximity to Olive Blvd and Highway 141, you are just a short drive away from all the best pa...
$299,500
$299,500
Available: Right Now
Great opportunity for a beautiful townhome located in the Parkway West area and also very close to many stores, restaurants, and major highways. This 3 bedroom 2.5 bath home features an open floor plan, stainless steel appliances with gas cooktop, ha...
$550,000
$550,000
Available: Right Now
Hello, Gorgeous! This stunning home in highly coveted Westbury Manor is one of a kind and on the market for the first time since being built! With 4 beds and 4 baths, and an open, warm floorplan, this home offers the sanctuary you've been looking for...
$245,000
$245,000
Available: Right Now
Beautiful townhouse on a quiet street. Newer hardwood floors. Fresh paint. Open floor plan. Updated kitchen (2022) with stainless steel refrigerator and big pantry. Update bathrooms (2022). Luxury master suite with makeup vanity. Large closets. Finis...
$224,900
$224,900
Available: Right Now
Welcome home to this 3 Bed, 3 Bath condo in Chesterfield! Lots of great updates- freshly painted, new flooring throughout, new kitchen, updated bathrooms, finished LL and includes 2 covered parking spots. You're greeted w/ new LVP flooring flowing ni...
$260,000
$260,000
Available: Right Now
This spacious, well maintained 2nd floor condo will check all of your wish list boxes. Large great room with a brick wood burning fireplace, wet bar with mini fridge and sliding glass door that leads to a private balcony, floor boards replaced 2 year...
$425,000
$425,000
Available: Right Now
$225,000
$225,000
Available: Right Now
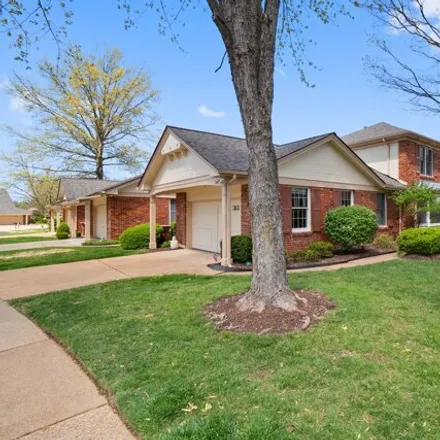
This delightful 3-bedroom, 2.5-bathroom villa promises effortless living without the hassle of yard work or exterior upkeep! Inside, you'll find a generously sized kitchen, a separate dining area, and a sunken living room featuring a welcoming gas fi...
Chesterfield
According to statistics, the population in Chesterfield, MO amounts to 47,660, which shows decline 0% compared to the previous year. The median age of the city’s residents is 47. The average household income is $99,848, shifting growth 3% from the past year, and the average property value in Chesterfield, MO growth 4% to $360,400 throughout the year.
| Population | 47,660 |
| Median Age | 46.8 |
| Poverty Rate | 5% |
| Household Income | $99,848 |
| Number Of Employees | 23,248 |
| Median Property Value | $360,400 |
What is the Average Price of Apartments for Sale in Chesterfield, MO?
| Month | Median Price |
|---|---|
| Apr 2024 |
$424,312
|
| Mar 2024 |
$424,312
|
| Feb 2024 |
$424,312
|
| Jan 2024 |
$424,312
|
| Dec 2023 |
$334,458
|
| Nov 2023 |
$477,769
|
| Month | Median Price |
|---|---|
| Apr 2024 |
$541,363
|
| Mar 2024 |
$541,363
|
| Feb 2024 |
$541,363
|
| Jan 2024 |
$541,363
|
| Dec 2023 |
$471,380
|
| Nov 2023 |
$620,176
|
Household Income
The average household income in Chesterfield, MO grew from $97,090 to $99,848 in the past year. This data is an estimate based upon 19,422 households in Chesterfield, MO . The chart below presents how household income is distributed in Chesterfield, MO in comparison to the revenue allocation amid households nationally.
Property Value
According to data from last year, the average property value in Chesterfield, MO shifted from $347,000 to $360,400 throughout the year. The subsequent graph indicates the share of properties in the given price range in Chesterfield, MO in comparison to the median property value in the same price segment across the country. According to the data, the greatest share of Chesterfield, MO properties falls in the '$300,000 to $399,999' range, which is higher than the most significant median property across the country.
Rent vs. Own
Property Taxes
One of the most important aspects for property owners is the amount of property taxes. This graph shows distribution of property taxes in Chesterfield, MO compared to median property taxes around the country. The prevalent amount of property taxes in Chesterfield, MO equals $3000, which is less than the national average.