Chula Vista, CA, USA apartments for sale
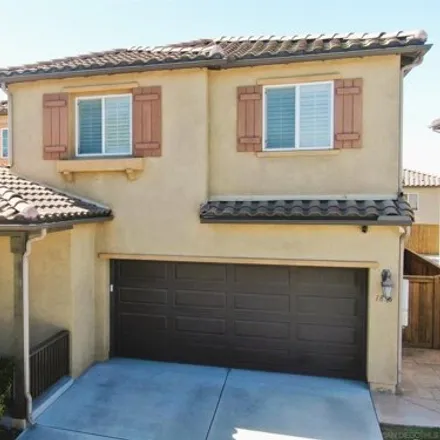
$469,000
$469,000
Available: Right Now
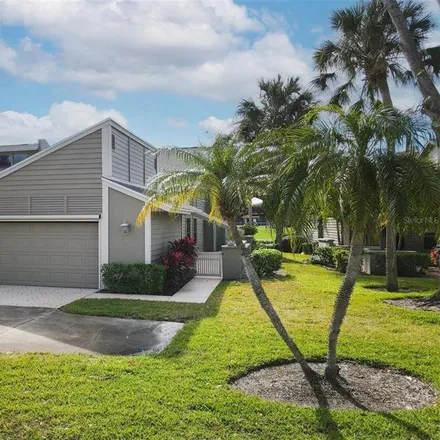
3 Bedrooms in this 2200+ SF living single story Turnkey furnished Villa on IMG golf course hole #4. Owner did extensive renovation in2014-2015,including removing main area walls to open up common area spaces, kitchen and bathroom cabinets, cou...
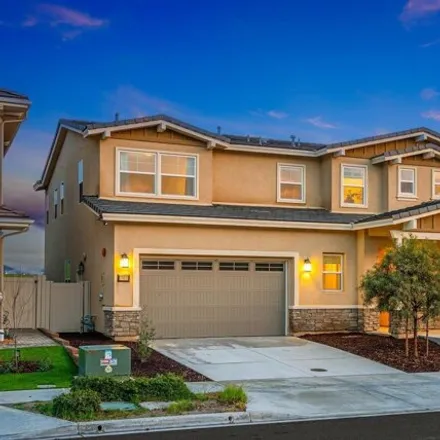
$1,35M
$1,35M
Available: Right Now
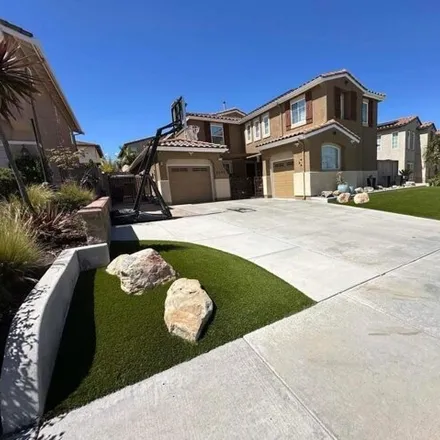
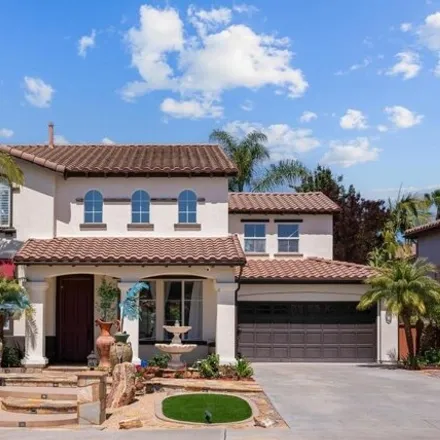
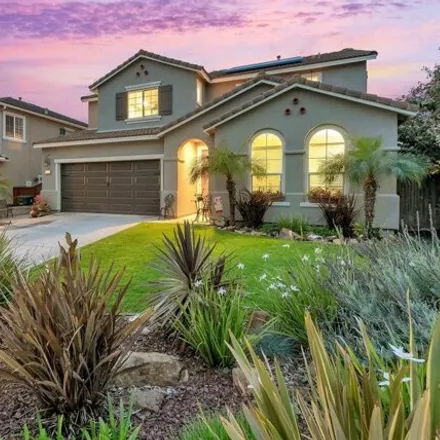
Frist time ever on the market !!! Rare to find ! Low hoa and mello roos ! Welcome home to the award winning community of eastlake ! Waiting for you is a meticulously maintained single family home, that perfectly blends ...
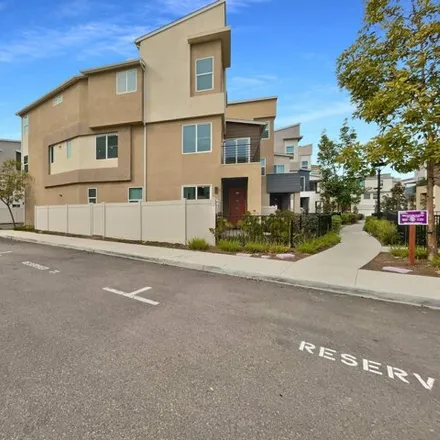
$1,5M
$1,5M
Available: Right Now
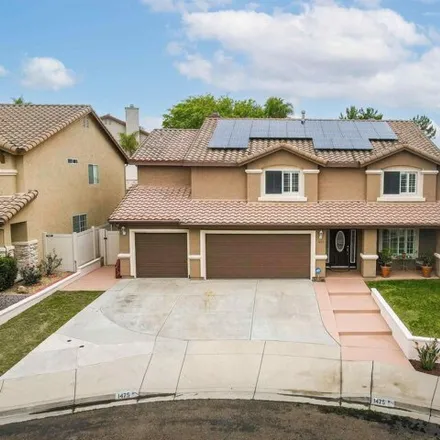
Pride of Ownership!! Big, Beautiful premium corner lot home that sits at the end of a quiet open-end cul-de-sac. Open floorplan with plenty of room to entertain inside or out. Large Dining room and Large family room with fireplace that flows nicely i...
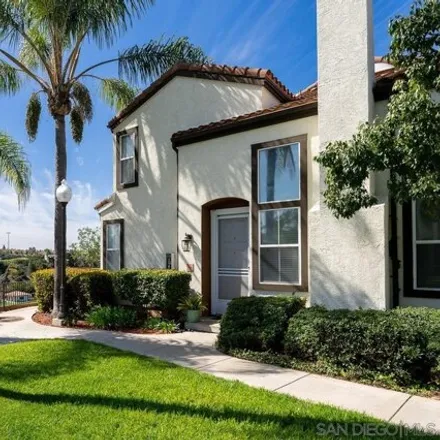
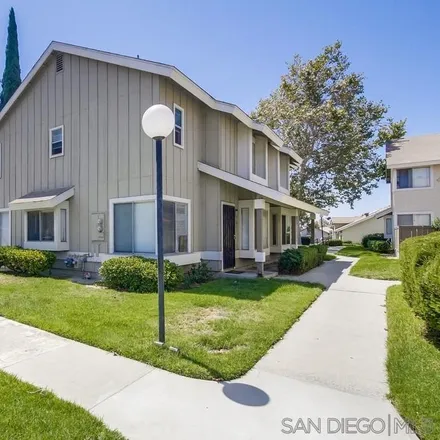
$689,000
$689,000
Available: Right Now
Welcome to a charming 3-bedroom, 2.5bathroom condo nestled in the sought-after Belleme Community of Otay Ranch. Upon entering, you'll find a spacious living room with natural light from large windows, creating a cozy and welcoming ambiance. The kitch...
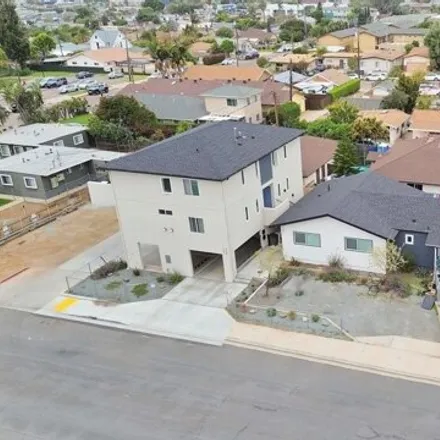
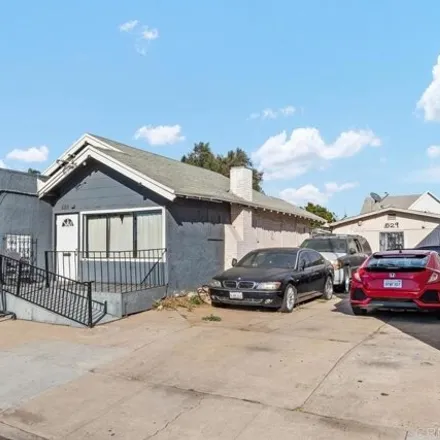
$2,4M
$2,4M
Available: Right Now
Incredible 4 unit opportunity in National City with strong rents in place. Property consists of 2 structures. Original 1-story home was taken down to the studs in 2022 and legally split into a 3 bed/2 bath PLUS a separate 1 bed/1 bath unit. 2nd struc...
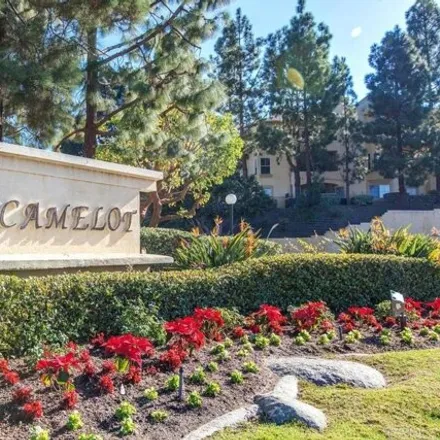
$675,000
$675,000
Available: Right Now
Welcome to Terrace Greens II Don't miss out on this incredible opportunity to own thisTURNKEYproperty in the Paradise Hills area of San Diego. As you approach, enjoy the great curb appeal and well maintained grounds of this gated community. Upon entr...
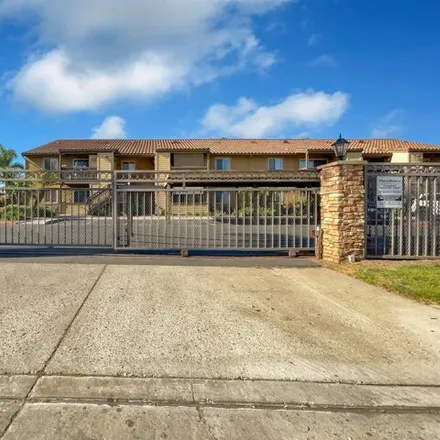
$800,000
$800,000
Available: Right Now
Location is Everything! This home is nestled in the back off this beautifully maintained gated community community within Rancho Del Rey. This home has a panoramic view from its patio of the park below and the surrounding greenery and canyon area. Th...
$660,000
$660,000
Available: Right Now
Welcome home to this stunning property boasting a natural color palette throughout. Other rooms offer flexible living space for your needs. The primary bathroom showcases double sinks and good under sink storage. With fresh interior paint and partial...
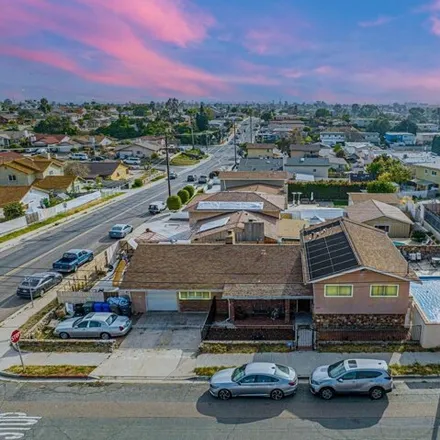
$879,000
$879,000
Available: Right Now
Great opportunity in san diego to live in home and rent other 2 units to pay for half of mortgage. Prime Multi-Use Investment with Growth Potential: Invest in San Diego's promise with this unique 3-unit property offering diverse revenue stream...
$404,000
$404,000
Available: Right Now
Welcome to this beautiful property boasting a natural color palette throughout, creating a serene and inviting atmosphere. The master bedroom effortlessly combines comfort and style, offering a spacious walk-in closet that caters to all your storage ...
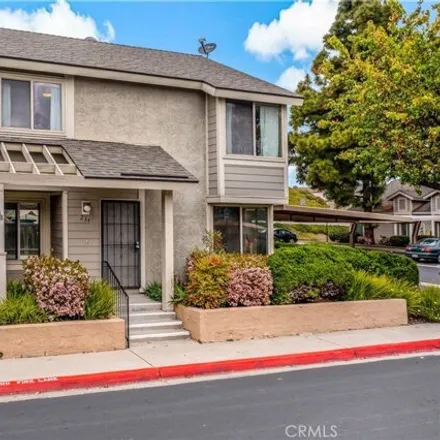
$559,000
$559,000
Available: Right Now
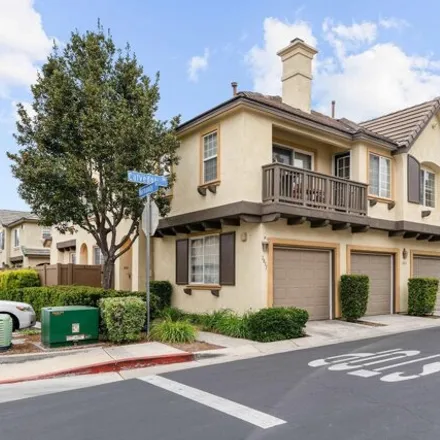
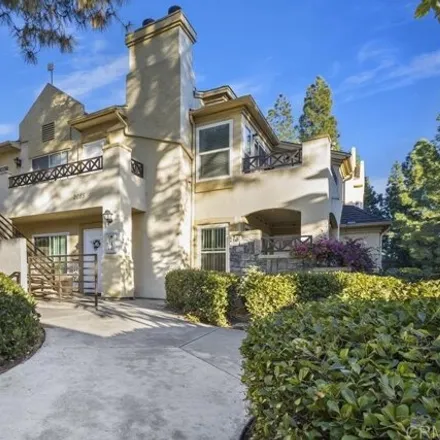
A great place to call home! You will love this light and bright upper level end unit in Eastlake, the living room with a cozy fireplace opens up to an out door balcony offering plenty of space to relax and enjoy the view. Master bedroom has its own b...
$899,999
$899,999
Available: Right Now
Welcome to your dream home in National City! This split-level residence offers the perfect blend of comfort, style, and potential. With 5 bedrooms, 3 bathrooms, and a spacious layout spanning2, 178sq ft, there's plenty of room for the whole family to...
$1,5M
$1,5M
Available: Right Now
Welcome to your New Home!!! Located in the heart of Rolling Hills Ranch. Home includes 5 bedrooms and 4 full baths. Embrace the high ceilings in this Valencia floor plan! Located on a quiet Cul-de-sac street. Main home includes 4 bedrooms, 3 full bat...
$829,990
$829,990
Available: Right Now
Beautiful home in gated Eastlake Summit. Open floor plan with high ceilings, cozy fireplace in living room, modern kitchen with walking pantry for your culinary side with stainless steel appliances and beautiful granite counter-tops. 3rd floor bonus ...
$900,000
$900,000
Available: Right Now
Offered from$850, 000-$900, 000.Discover the perfect blend of comfort and style at 1653 Jones Street. This inviting 3-bedroom, 2.5-bathroom home offers a modern living experience in a vibrant neighborhood. Step inside to find a spacious and bright in...
$948,000
$948,000
Available: Right Now
Priced to sell, an amazing investment opportunity, and great for entertaining. Welcome to this exquisite 4-bed 3.5-bath home in the highly desirable Sunbow community. Excellent floor plan with the perfect combination of open space and cozy areas. Enj...
$998,500
$998,500
Available: Right Now
Discover the perfect blend of comfort and convenience in this beautifully maintained home nestled in the sought-after neighborhood of Otay Ranch, Chula Vista. This property features three spacious bedrooms and two full bathrooms upstairs, a dedicated...
$1,99M
$1,99M
Available: Right Now
Introducing this exquisite home nestled in the sought-after Montecito Village community, offering a blend of elegance, modernity, and comfort. Step inside to discover a captivating space adorned with handsome engineered hardwood flooring that flows s...
$922,000
$922,000
Available: Right Now
This lovely contemporary home in the highly desirable Skylar at Millenia Community has the open floor plan concept. The bright and delightful chef's kitchen boast beautiful countertops, cabinets, storage and stainless steel appliances. Its open conce...
$490,000
$490,000
Available: Right Now
$545,999
$545,999
Available: Right Now
Introducing a stunning two bedroom, two bath condo nestled in the highly coveted Eastlake area, boasting floor-level entry for ultimate convenience. Prime location within walking distance to scenic lakeside views, renowned restaurants, coffee shops, ...
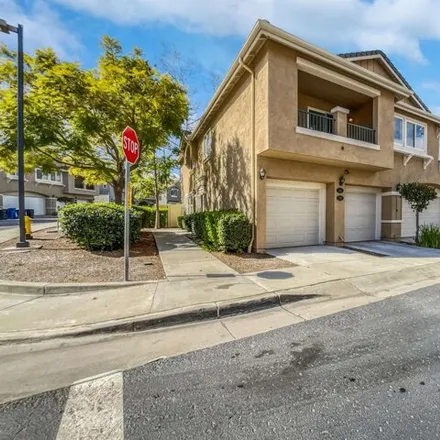
$1,1M
$1,1M
Available: Right Now
Beautiful home in the San Miguel Ranch Community waiting for it's new owner! The home has 4 Bedrooms, loft, and Den than can easily be a 5th bedroom. Full Bedroom and Full Bath downstairs! Open kitchen concept with it's own kitchenette in addition to...
Chula Vista
According to statistics, the population in Chula Vista, CA amounts to 271,653, which shows decline 0% compared to the previous year. The median age of the city’s residents is 35. The average household income is $86,082, shifting growth 11% from the past year, and the average property value in Chula Vista, CA growth 7% to $532,700 throughout the year.
| Population | 271,653 |
| Median Age | 34.6 |
| Poverty Rate | 12% |
| Household Income | $86,082 |
| Number Of Employees | 126,543 |
| Median Property Value | $532,700 |
Household Income
The average household income in Chula Vista, CA grew from $77,273 to $86,082 in the past year. This data is an estimate based upon 78,112 households in Chula Vista, CA . The chart below presents how household income is distributed in Chula Vista, CA in comparison to the revenue allocation amid households nationally.
Property Value
According to data from last year, the average property value in Chula Vista, CA shifted from $497,800 to $532,700 throughout the year. The subsequent graph indicates the share of properties in the given price range in Chula Vista, CA in comparison to the median property value in the same price segment across the country. According to the data, the greatest share of Chula Vista, CA properties falls in the '$500,000 to $749,999' range, which is higher than the most significant median property across the country.
Rent vs. Own
Property Taxes
One of the most important aspects for property owners is the amount of property taxes. This graph shows distribution of property taxes in Chula Vista, CA compared to median property taxes around the country. The prevalent amount of property taxes in Chula Vista, CA equals $3000, which is less than the national average.