Cibolo, TX, USA apartments for sale
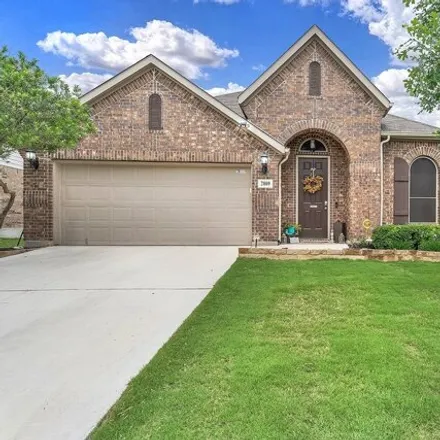
$363,000
$363,000
Available: Right Now
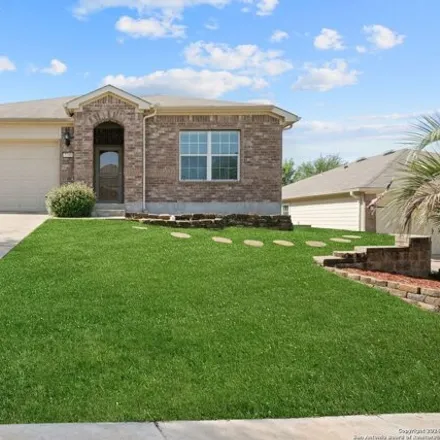
Welcome to this stunning single-story home that offers the perfect blend of comfort, luxury and Pride of Ownership!! The beauty of the high-end-builder Gehan with a price you can afford with 3-sides Brick! An elegant 8 Ft front door opens to a wide e...
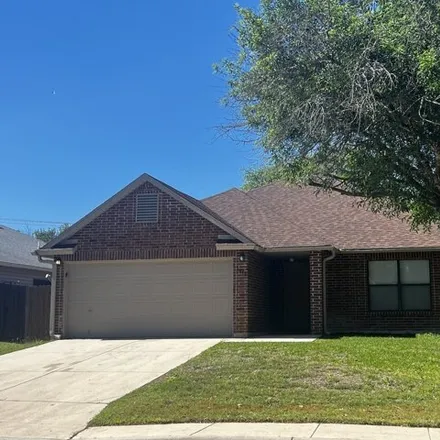
$265,000
$265,000
Available: Right Now
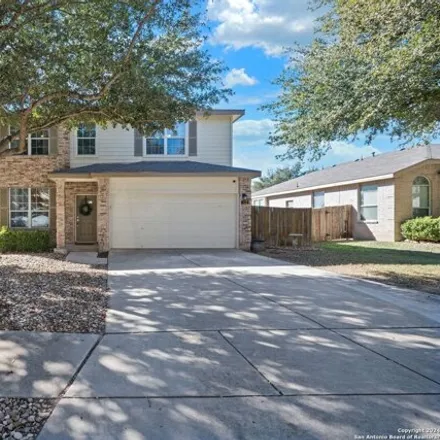
Spacious Single Story Home in Ashley Place. Only a block from the park, this charming house is very welcoming. Large Bright Family room Dining Room and eat in Kitchen welcome you in. The kitchen is very spacious and has an island for extra workspace....
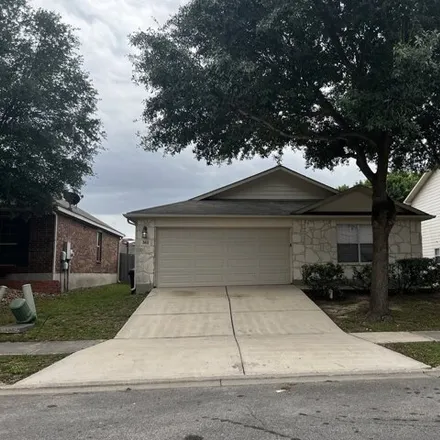
$269,900
$269,900
Available: Right Now
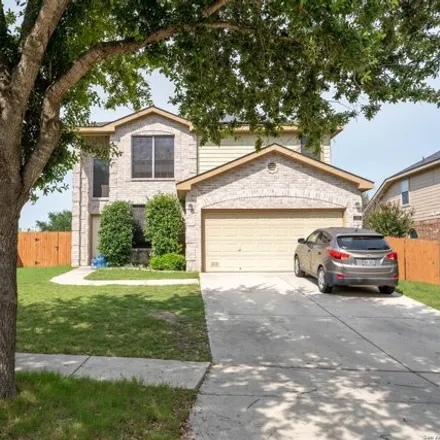
Really nice neighborhood. Lots of mature trees and multiple park. This spacious single story house is fantastic. Large open family room with dining attached has lots of natural light. Spacious eat in kitchen with a breakfast bar looks into the family...
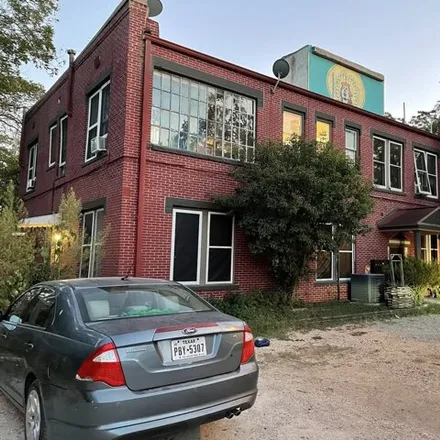
$750,000
$750,000
Available: Right Now
The historic building in beautiful downtown Schertz, Texas, which was once a hospital and is now being offered for sale as a multifamily apartment complex, is a true gem that combines rich history with modern living. Nestled in the heart of downtown ...
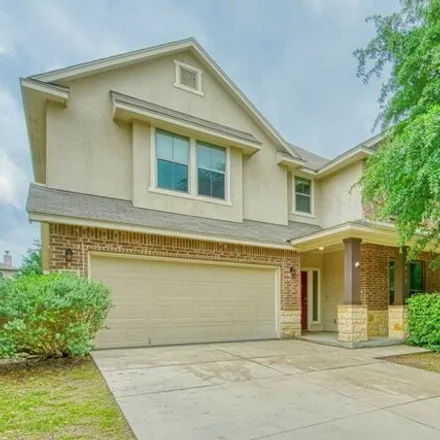
$475,000
$475,000
Available: Right Now
This pristine two story home is situated on an oversized cul-de-sac lot and located in the highly sought after neighborhood of The Ridge at Deer Creek. Floor plan includes an amazing 2021 kitchen remodel which includes custom oak cabinets, barn-style...
$460,000
$460,000
Available: Right Now
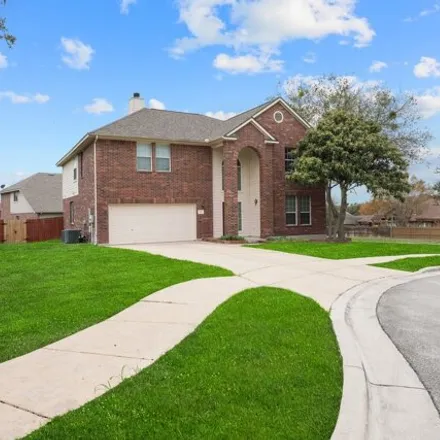
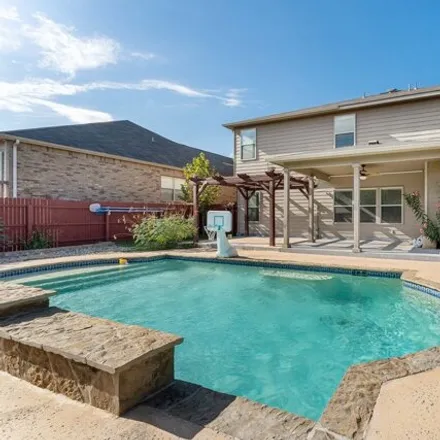
This expansive home offers all the space and privacy to enjoy as well as convenience to all major highways. Aside from the sparkling pool in the back, this home features an open floor plan with high ceilings, multiple living areas, cozy kitchen, form...
$415,000
$415,000
Available: Right Now
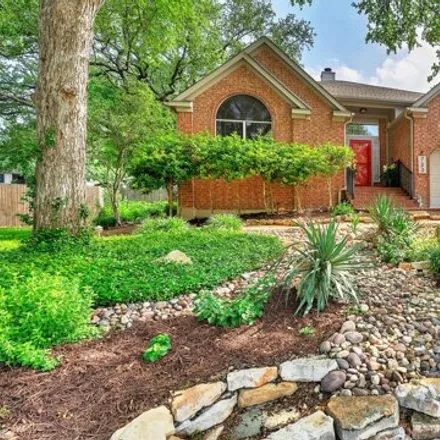
This is a fantastic place to call home. It is bursting with curb appeal at the end of a cul-d-sac. It is situated on a.267-acre lot in the very highly desired Woodland Oaks. The landscaping and tree's are stunning. The living quarters are 2200 sf tha...
$295,000
$295,000
Available: Right Now
Well maintained 3 bedroom, 2 bathroom home in the heart of Cibolo! The presence of natural light is evident upon entering. Tile floors throughout the first floor make for easy care and cleaning!! Plenty of cabinet and countertop space in this open ki...

$599,900
$599,900
Available: Right Now
Custom built home located in a cul-de-sac in highly desirable Marion, Texas. Meticulously maintained and thoughtfully designed this home offers everything one could desire. Three bedroom, two bath and optional study/fourth bedroom. Enjoy endless hour...
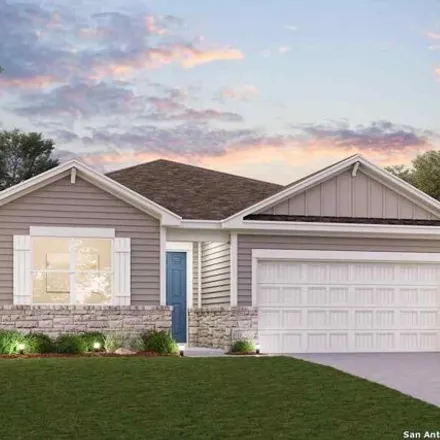
$384,990
$384,990
Available: Right Now
At the front of the Brazos, a stylish and functional floor plan, the foyer leads past the laundry room to two secondary bedrooms, with easy access to a full hall bath as well as a drop zone leading into another secondary bedroom-with a full private b...
$399,990
$399,990
Available: Right Now
Love where you live in Venado Crossing in Cibolo, TX! The Addison floor plan is a charming 1-story home with 3 bedrooms, 2.5 bathrooms, and a 2-car garage. This home has it all with aRARE 1/2bath and study! With a large island overlooking the family ...
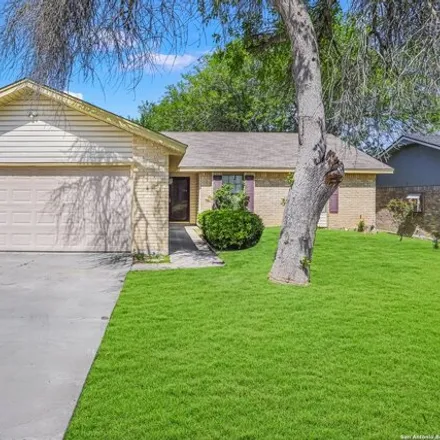
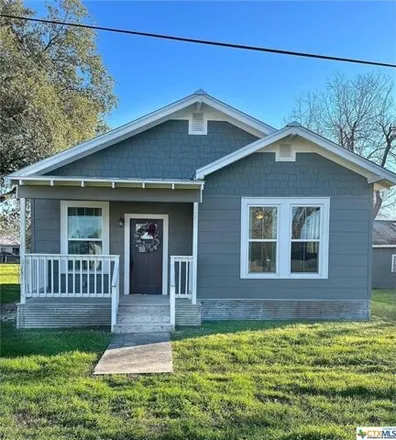
$259,000
$259,000
Available: Right Now
Immaculately maintained one story Ranch style home with excellent floor plan! Fresh paint...move in ready! Pretty flooring through out!! Huge living room with vaulted ceilings and corner fireplace! Chefs will love the big kitchen with center island a...
$400,000
$400,000
Available: Right Now
Open house Saturday4/27 12-2pm. Welcome to your dream home! This home boasts exquisite architectural design with beautiful arches and large travertine tiles that seamlessly blends elegance with functionality. Enjoy ample living space with five...
$329,500
$329,500
Available: Right Now
Step into the charm of this beautifully renovated 2-bedroom, 2-bath farmhouse nestled in the heart of quaint downtown Marion. With a modern makeover completed in 2021, no detail has been spared in this just-under-1/2-acre gem. The cozy front porch we...
$529,500
$529,500
Available: Right Now
4 BR-3.1Baths with 3 Car Garage- 2-Story 3225 sf, 2009 Home in the Enclave of Riata Oaks. Sits on a spacious Corner Lot with Shade Trees, Front and Back Landscaping and Sprinkler System Schertz-Cibolo ISD 2 Living Areas, Separate Dining, Breakfast Ar...
$275,000
$275,000
Available: Right Now
Well desired Willow Pointe Enclave Subdivision! Master down with two Living Areas, Separate Dining Room, Eat-In Kitchen, Utility Room Inside, Master Bedroom Downstairs, Large Game Room, Storage shed in back yard. Interior freshly painted; Roof replac...
$375,000
$375,000
Available: Right Now
This inviting 4-bedroom, 2.5-bathroom home offers a blend of comfort and functionality, perfect for families seeking a welcoming retreat. Located in a family-friendly neighborhood where you can enjoy a walk to the community pool and playground, it's ...
$299,000
$299,000
Available: Right Now
Welcome home! This beautiful property has been very well maintained, and has an unbeatable view of San Antonio off the front porch! The open floorplan is inviting and very comfortable, with the primary suite secluded from the secondary bedrooms. The ...
$340,000
$340,000
Available: Right Now
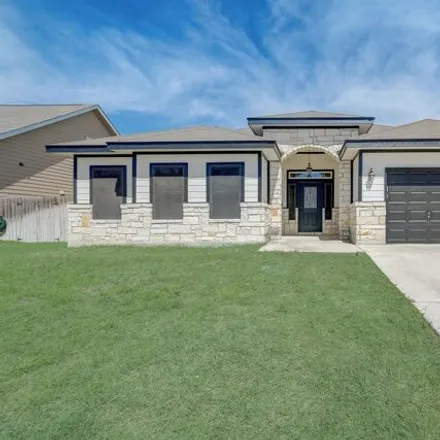
Experience comfort and class in this modern luxury home with 9' ceilings. Large open kitchen has 42 white painted custom cabinets and granite counter tops. The living room has vaulted ceilings. Dark stone look tile is in all living areas, baths, laun...
$334,999
$334,999
Available: Right Now
Welcome to your new Home sweet home ! This stunning traditional home is located inSCUCISD,boasts an open floor plan and sizable eat-in kitchen, making it perfect for entertaining guests or hosting gatherings. The high soaring ceilings allow fo...
$312,500
$312,500
Available: Right Now
Solar energy savings !!! Majestic brick entry on an oversized lot with mature trees. Wood grain and ceramic tile usher you into a comfy family room with open views to the breakfast and kitchen. Chef's delight island kitchen with loads of count...
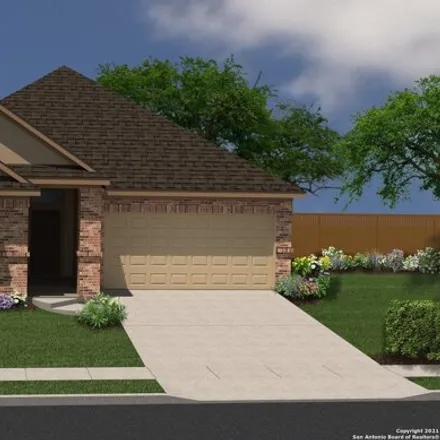
$388,654
$388,654
Available: Right Now
This home offers a perfect blend of style and convenience. Nine-ft. first-floor ceilings and rugged yet beautiful vinyl plank flooring at the entry, great room, and kitchen open the space. The kitchen is a culinary haven, featuring stainless steel Wh...
Cibolo
According to statistics, the population in Cibolo, TX amounts to 26,602, which shows growth 5% compared to the previous year. The median age of the city’s residents is 34. The average household income is $92,773, shifting growth 1% from the past year, and the average property value in Cibolo, TX growth 4% to $214,500 throughout the year.
| Population | 26,602 |
| Median Age | 33.7 |
| Poverty Rate | 6% |
| Household Income | $92,773 |
| Number Of Employees | 11,775 |
| Median Property Value | $214,500 |
What is the Average Price of Apartments for Sale in Cibolo, TX?
| Month | Median Price |
|---|---|
| Apr 2024 |
$387,380
|
| Mar 2024 |
$387,380
|
| Feb 2024 |
$387,380
|
| Jan 2024 |
$387,380
|
| Dec 2023 |
$407,954
|
| Nov 2023 |
$373,368
|
| Month | Median Price |
|---|---|
| Apr 2024 |
$357,557
|
| Mar 2024 |
$357,557
|
| Feb 2024 |
$357,557
|
| Jan 2024 |
$357,557
|
| Dec 2023 |
$369,676
|
| Nov 2023 |
$356,142
|
Household Income
The average household income in Cibolo, TX grew from $91,827 to $92,773 in the past year. This data is an estimate based upon 7,963 households in Cibolo, TX . The chart below presents how household income is distributed in Cibolo, TX in comparison to the revenue allocation amid households nationally.
Property Value
According to data from last year, the average property value in Cibolo, TX shifted from $206,900 to $214,500 throughout the year. The subsequent graph indicates the share of properties in the given price range in Cibolo, TX in comparison to the median property value in the same price segment across the country. According to the data, the greatest share of Cibolo, TX properties falls in the '$200,000 to $249,999' range, which is lower than the most significant median property across the country.
Rent vs. Own
Property Taxes
One of the most important aspects for property owners is the amount of property taxes. This graph shows distribution of property taxes in Cibolo, TX compared to median property taxes around the country. The prevalent amount of property taxes in Cibolo, TX equals $3000, which is less than the national average.