Cicero, IL, USA apartments for sale

$499,999
$499,999
Available: Right Now
Welcome to the Black House! This beautiful, contemporary, fully remodeled brick two-unit property has stunning curb appeal. Each unit features 3 bedrooms and 1 full bathroom, along with a formal living room, dining room, and a massive kitchen to ente...

$280,000
$280,000
Available: Right Now
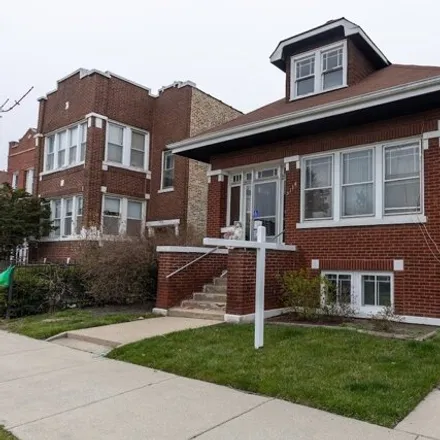
Charming brick home on lovely tree lined street in much desired Cicero. Newly finished hardwood floors, granite kitchen counters, spacious size (3) bedrooms on main floor, living room with eat in kitchen. Attic is unfinished but ready for you to be c...

$139,900
$139,900
Available: Right Now
Well cared for top floor unit with plenty of natural light filtering into a nice open concept space. This unit offers 2 bedroom a good size kitchen with white wood cabinets and plenty of storage including a pantry. Dining area has space for a large t...
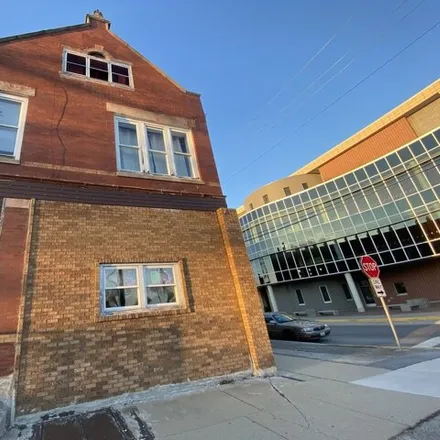
$400,000
$400,000
Available: Right Now
Prime Location near everything, pink line, near schools, solid Brick building, four unit with HUGE attic for potential expansion of 2nd floor units to duplex, Must see the size of thisUNIQUEbuilding , 100% Tax prorations. buyer responsible for...
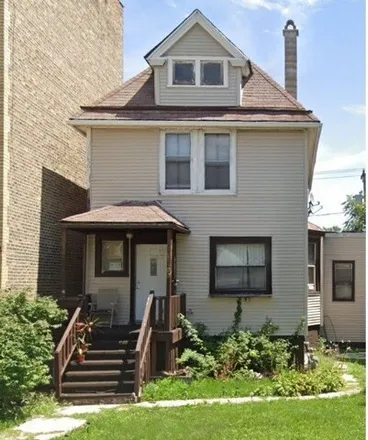
$129,000
$129,000
Available: Right Now
Property is vacant show anytime. regular sale. 2 unit building. Full unfinished basement. Private seller - fast closing. Bring flashlight. Regular closing no short sale or foreclosure. Property will sell with clean title, no back taxes and wat...

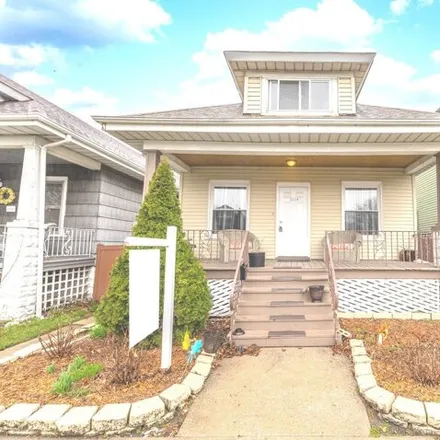
$269,900
$269,900
Available: Right Now
Beautiful Cicero brick 2 Flat / 3 bedrooms in each unit / full partially finished basement / 2 Car Garage / Close to shopping and public transportation / Property being sold in AS IS condition, no surveys nor disclosures, taxes pro rated 100% / Pleas...

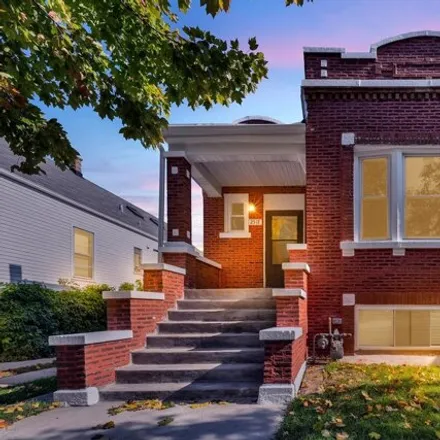
$425,000
$425,000
Available: Right Now
Cicero, IL Welcome to one of the largest Georgians you'll find in South Cicero. Enjoy hosting your guests in this open-concept first floor, featuring hardwood flooring throughout. The delightful kitchen boasts 42 cabinets, quartz countertops, a spaci...

$249,000
$249,000
Available: Right Now
3 bedroom, 1 bath, living room and dining room. newer floor and new kitchen cabinets. full unfinish basement, House is in good conditions and ready to move in. solid-brick home in great area near public transportation, shopping and entertainment. Sol...

$489,999
$489,999
Available: Right Now
Endless sunlight fill this stunning brick georgian with amazing kitchen, 4 bedrooms and 3 full bathrooms !! Amazing master suite with 2 closets, 4 massive windows and a stunning master bathroom ! CHEF' S style kitchen with 30 ...

$429,900
$429,900
Available: Right Now
Discover a Unique Opportunity to Own a Jumbo 2 Flat on Austin Blvd on an expansive lot with a coveted side driveway. This property is a true gem, featuring well-maintained original custom millwork and stunning stained glass throughout. As you step in...

$429,900
$429,900
Available: Right Now
This beautiful legal two-unit giant is a cash cow ! Completely remodeled in 2015, both units flaunt rich hardwood flooring, formal living and dining rooms, kitchen cabinets, granite countertops, and stainless-steel appliances ! Remod...

$229,999
$229,999
Available: Right Now
Don't miss out on this fantastic opportunity to own a charming starter home in Cicero, complete with a double lot! This property features a spacious living room, separate dining room, master bedroom with closet, an additional bedroom with closet, a b...

$1,25M
$1,25M
Available: Right Now
10% Cap Rate As-Is (Proforma 11% + Cap Rate)! This 13 unit workforce housing property is located in Cicero, IL just outside Chicago and steps from Pink L Stop. Current ownership has made significant capital improvements over the years. Interior impro...
$259,000
$259,000
Available: Right Now
Welcome to3116 S52nd Ct in the sought-after South Cicero neighborhood. This lovely home boasts 4 generously sized bedrooms, a fully equipped bathroom, and a finished attic, providing ample space for your family's comfort and growth. The expansive bas...

$248,888
$248,888
Available: Right Now
Cute and cozy brick single family home located in blvd manor features 3-bedrooms. one on main level and two on the 2nd level. updated bath. updated cabinet kitchen off dining area. laundry room/utility room in rear. newer roof on home and garage. ...
$454,999
$454,999
Available: Right Now
Stunning single-family home in Cicero! The main level offers a spacious living room, dining room, master bedroom, two additional bedrooms, a modern full bathroom, and a fully equipped kitchen with a modern design, ample cabinet space, and stainless s...
$295,000
$295,000
Available: Right Now
Long time owner of this Chicago Style Bungalow! Home features: 4 nice bedrooms, 2 floor drywalled and ready to be finished, 1 1/2baths, central A/C, some new windows, security system, new electric in 2023 and original hardwood floors and trim! Nice y...

$129,900
$129,900
Available: Right Now
This incredible 2 Bed 1 bath Condo is located in an ideal part of the town of Cicero. Location is near all of the restaurants, shopping, nightlife, entertainment, and just a short two block walk to the Pink line for easy commuting. From the moment yo...

$465,000
$465,000
Available: Right Now
Investment opportunity in Cicero, IL, featuring a maintained 4-unit brick/mason building that is perfect for adding to your investment portfolio. 4 spacious apartments, each offering 2 bedrooms and 1 bathroom. Recent Upgrades: The property has underg...

$340,000
$340,000
Available: Right Now
Take a look at this beautiful brick two-unit building, perfect for live in owner or investor. The first unit, located on the ground floor, features 2 bedrooms, 1 full bathroom, and a bright and spacious kitchen-dining area and enclosed back porch. Th...

$242,000
$242,000
Available: Right Now
Multi-unit property that was refurbished in 2014. Purchase this property and you can rent one unit and live in the other. It's in a great location. 2 blocks from the elementary school and 3 blocks from the park. There are several updates on this prop...

$1,5M
$1,5M
Available: Right Now
Classic masonry charmer consisting of 19 apartments and 2 storefronts for a total of 21 units. three stories. incredibly woodwork throughout. major ticket upgrades completed in last few months- staircases, concrete walkways, french tile, electrica...
Cicero
According to statistics, the population in Cicero, IL amounts to 83,735, which shows decline 0% compared to the previous year. The median age of the city’s residents is 29. The average household income is $44,110, shifting growth 4% from the past year, and the average property value in Cicero, IL growth 8% to $139,100 throughout the year.
| Population | 83,735 |
| Median Age | 29.3 |
| Poverty Rate | 20% |
| Household Income | $44,110 |
| Number Of Employees | 36,772 |
| Median Property Value | $139,100 |
What is the Average Price of Apartments for Sale in Cicero, IL?
| Month | Median Price |
|---|---|
| Jun 2024 |
$309,558
|
| May 2024 |
$274,259
|
| Apr 2024 |
$270,630
|
| Mar 2024 |
$270,630
|
| Feb 2024 |
$270,630
|
| Jan 2024 |
$270,630
|
| Month | Median Price |
|---|---|
| Jun 2024 |
$353,249
|
| May 2024 |
$347,967
|
| Apr 2024 |
$355,145
|
| Mar 2024 |
$355,145
|
| Feb 2024 |
$355,145
|
| Jan 2024 |
$355,145
|
Household Income
The average household income in Cicero, IL grew from $42,345 to $44,110 in the past year. This data is an estimate based upon 22,302 households in Cicero, IL . The chart below presents how household income is distributed in Cicero, IL in comparison to the revenue allocation amid households nationally.
Property Value
According to data from last year, the average property value in Cicero, IL shifted from $129,000 to $139,100 throughout the year. The subsequent graph indicates the share of properties in the given price range in Cicero, IL in comparison to the median property value in the same price segment across the country. According to the data, the greatest share of Cicero, IL properties falls in the '$100,000 to $124,999' range, which is lower than the most significant median property across the country.
Rent vs. Own
Property Taxes
One of the most important aspects for property owners is the amount of property taxes. This graph shows distribution of property taxes in Cicero, IL compared to median property taxes around the country. The prevalent amount of property taxes in Cicero, IL equals $3000, which is less than the national average.