Claremont, NH, USA apartments for sale
$324,999
$324,999
Available: Right Now
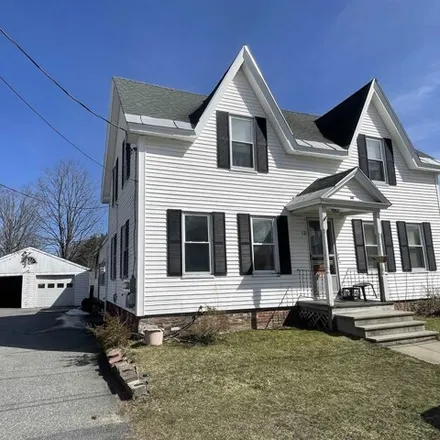
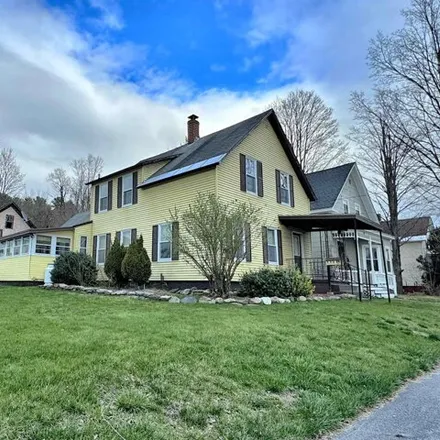
This multi-family property offers an excellent opportunity for both owner occupancy and rental income. The first floor features three bedrooms and two full baths, including a master bedroom with an attached full bathroom and separate entry door. The ...
$179,000
$179,000
Available: Right Now
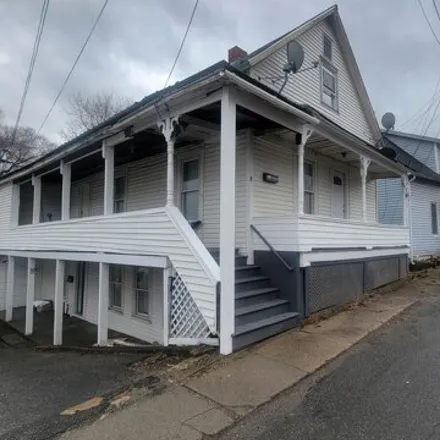
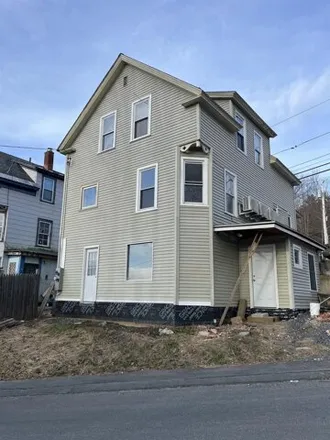
Two unit building. First floor unit has 2 bedrooms and 1 full bath, and has been renovated with new flooring, paint, kitchen counter tops, along with some vinyl windows. Second floor unit provides 2 good size bedrooms and a full bathroom, with additi...
$540,000
$540,000
Available: Right Now
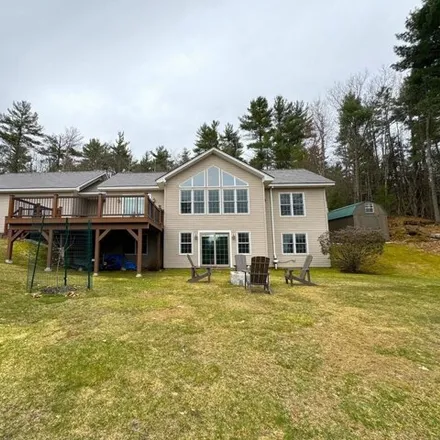
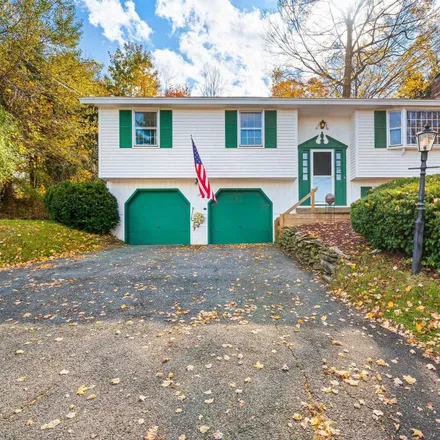
Showings start:April 20th. Open House Saturday 20th10AM - 12PM.Step through the front door and be greeted by an inviting living space that effortlessly combines modern elegance with cozy comfort. High ceilings, clean lines, floor to ceiling windows i...
$789,000
$789,000
Available: Right Now
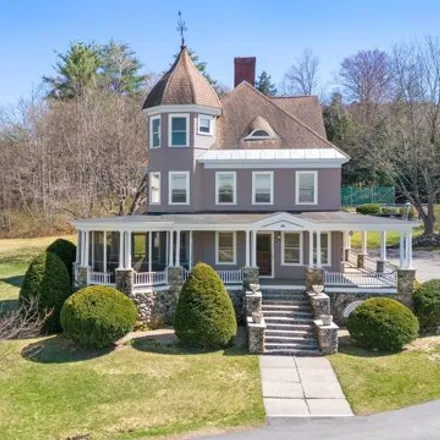
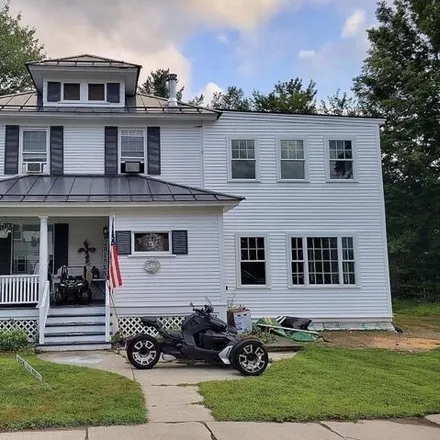
Rare opportunity to purchase this one of a kind Home. This Circa 1900 Victorian, showcases Stained Glass Windows, Beautifully Crafted Woodwork, Hardwood Floors, Elegant Double Parlors, first floor Den/Bedroom with Ensuite, Formal Dining Room, Fully R...
$254,500
$254,500
Available: Right Now
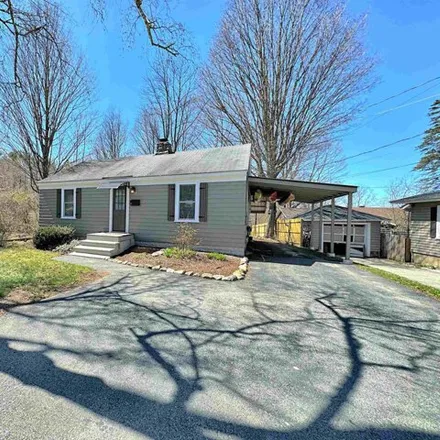
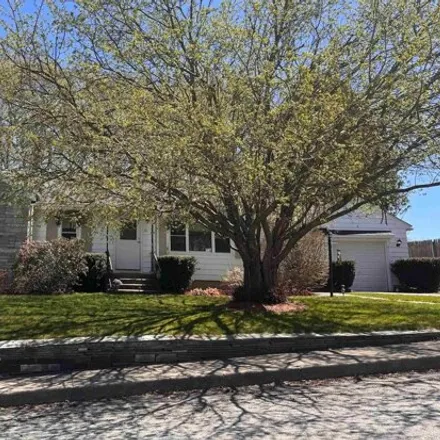
Showings start may 4th . open house may 4th 10am-12pm. This 3 bedroom (could be turned into 4 bedroom) home is within easy reach of an array of dining, entertainment, and minutes from the hospital. Walking distance to a convenient store...
$170,000
$170,000
Available: Right Now
Great opportunity for a new or seasoned Investor to Buy, Rehab and Rent. Then refinance, get your cash back and do it again! Lots of work has already been performed including a New Roof in 2023, updated wiring, plumbing and insulation. The 2 family b...
$230,000
$230,000
Available: Right Now
$460,000
$460,000
Available: Right Now
This is a large 4 bedroom 3.5 bath 3000+ square foot modern and fully updated home with an office space. Located on.4 acres of land in a much desired part of Claremont, NH. This home has a brand new 1100 square foot addition adding a massive family r...
$219,000
$219,000
Available: Right Now
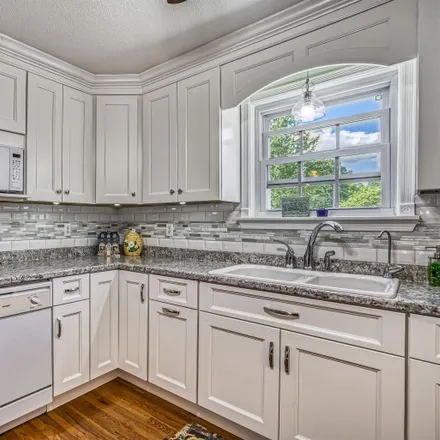
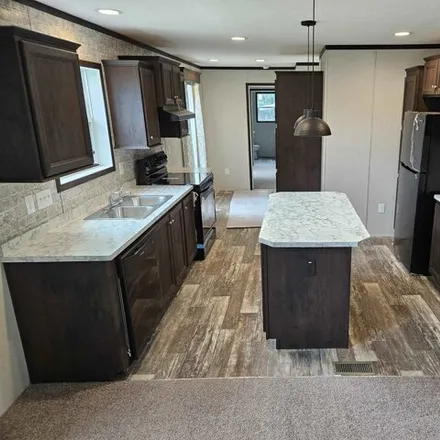
Step inside to discover a cozy living space with all the modern conveniences. (Previous owner remolded home. Insulation, drywall, recessed lighting, remodeled kitchen and bathroom.etc..)The open floor plan seamlessly connects the living area, kitchen...
$139,900
$139,900
Available: Right Now
$275,000
$275,000
Available: Right Now
Rock solid ranch style home with an in-law apartment in the basement. 2 bedrooms up and 2 in the basement. 2 kitchens with 2 sets of appliances. includes a back deck and an oversized 1 car garage. lots of living space with 2 separate quarters. the...
$299,000
$299,000
Available: Right Now
$199,900
$199,900
Available: Right Now
OWN? Versus RENT? We are certain this is a question every 1st time Buyer is asking themselves. Do I continue to rent and throw my money away or purchase (with great 1st time buyer financing programs no money down and grants)? Its obvious to buy! Its ...
$219,900
$219,900
Available: Right Now
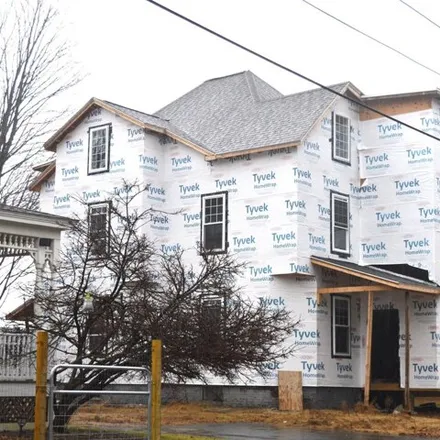
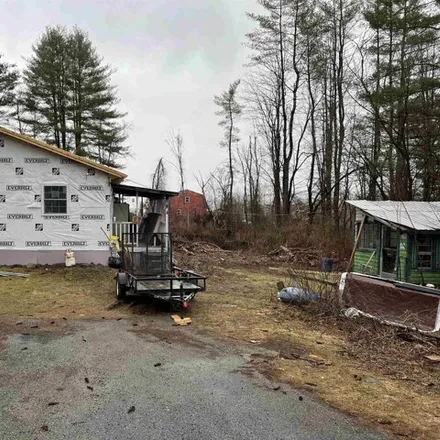
The builder bought and took down this house completely to the studs in order to start from scratch to build the new home.This house has been totally stripped down to its bare bones, and pretty much the only things left are the floor plan and the orig...
$525,000
$525,000
Available: Right Now
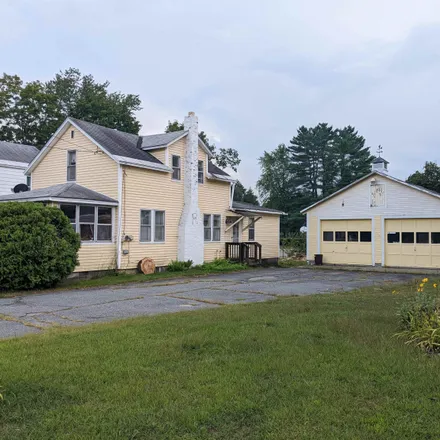
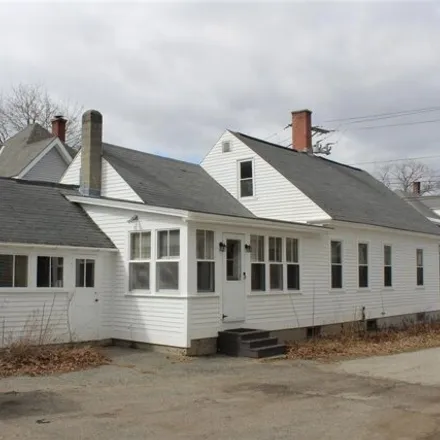
This Versatile Property Checks a Lot of Boxes For You With a 1794 Vintage 2262 Square Foot Post and Beam 3-4 Bedroom 2 Bath Cape Where Rehab is Nearly Completed. New Standing Seam Roof, New Electrical Plumbing and Heating Systems, and Spray Foam Insu...
$190,000
$190,000
Available: Right Now
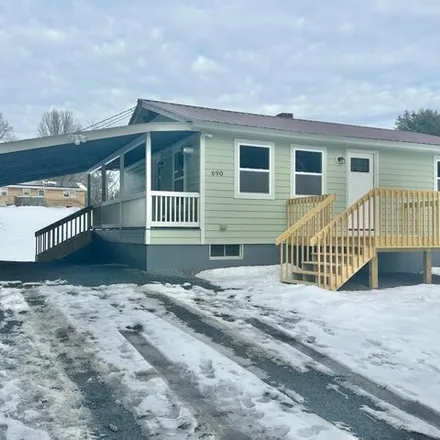
Great to be the first one to enjoy this new home! Comfortable layout with bedrooms at opposite ends. Tasteful colors and finishings. Entrance has washer/dryer hook ups. Kitchen is open to Livingroom with matching drapes in place. Everyone enjoys a ce...
$239,900
$239,900
Available: Right Now
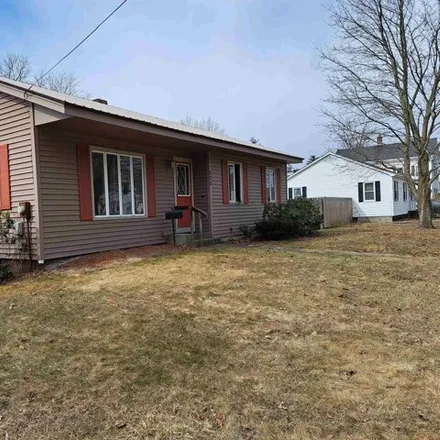
Fore!!This recently spruced up ranch abuts the Claremont Country Club! Bring your golf cart! Also easy to hop on I91 to go to Vermont or Dartmouth Health and Dartmouth College. This house has extra special curb appeal. Open concept Living Room/Dining...
$175,000
$175,000
Available: Right Now
You next project house is here! The 876 sq' house is 100% new build and many of the new materials to complete the build are available. You know about the limited inventory and so this property is in high demand. Ideal for rental, for loved one or for...
$319,000
$319,000
Available: Right Now
This 2 Bedroom 1 Bath upgraded home is turn-key and move in ready. Renewed exterior, new windows and doors, appliances, flooring, and fixtures. This home provides a quaint rural setting with access to amenities. Neighborhood is quiet and friendly. La...

$84,000
$84,000
Available: Right Now
A great little home is now available in the desirable Pleasant Valley Estates Co-op. This 2 bedroom, one bath home has been brought into the 21st century! ALL NEW:slab, tie downs, skirting, water heater, interior paint, kitchen cabinets and counters,...
$689,900
$689,900
Available: Right Now
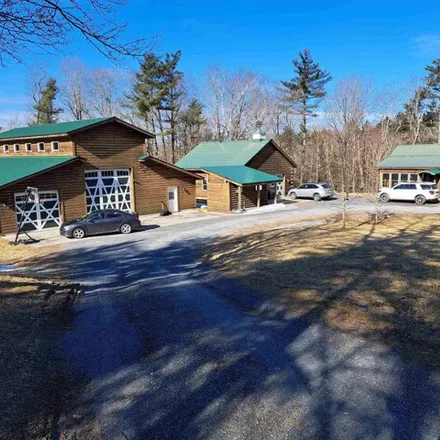
Unique offering ! This is a cozy country log home with 10.3 acres on a dead end road with incredible out buildings. this one offers 2 bedrooms, 2 baths, and a partially finished basement. one of the out buildings is a 50 ' X 50' Insu...
$825,000
$825,000
Available: Right Now
Welcome to a piece of history! Nestled along 400 feet of Connecticut River frontage, this 5-bedroom Colonial masterpiece, built in 1922 by Col. William Wilgus, the visionary engineer behind Grand Central Station, exudes timeless charm and sophisticat...
Claremont
According to statistics, the population in Claremont, NH amounts to 13,028, which shows decline 0% compared to the previous year. The median age of the city’s residents is 43. The average household income is $46,639, shifting decline -2% from the past year, and the average property value in Claremont, NH decline -4% to $132,500 throughout the year.
| Population | 13,028 |
| Median Age | 42.8 |
| Poverty Rate | 13% |
| Household Income | $46,639 |
| Number Of Employees | 6,256 |
| Median Property Value | $132,500 |
Household Income
The average household income in Claremont, NH declined from $47,555 to $46,639 in the past year. This data is an estimate based upon 5,567 households in Claremont, NH . The chart below presents how household income is distributed in Claremont, NH in comparison to the revenue allocation amid households nationally.
Property Value
According to data from last year, the average property value in Claremont, NH shifted from $137,300 to $132,500 throughout the year. The subsequent graph indicates the share of properties in the given price range in Claremont, NH in comparison to the median property value in the same price segment across the country. According to the data, the greatest share of Claremont, NH properties falls in the '$150,000 to $174,999' range, which is lower than the most significant median property across the country.
Rent vs. Own
Property Taxes
One of the most important aspects for property owners is the amount of property taxes. This graph shows distribution of property taxes in Claremont, NH compared to median property taxes around the country. The prevalent amount of property taxes in Claremont, NH equals $3000, which is less than the national average.