Clarksville, TN, USA apartments for sale
$365,900
$365,900
Available: Right Now
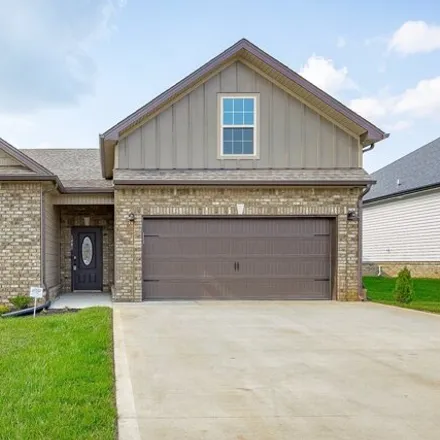
Welcome home to the Birchwood! This cozy home offers a spacious living room with a fireplace, the owner's suite, two additional bedrooms, and a convenient laundry room all on the main level. The kitchen offers stainless steel appliances, a stylish ba...
$347,800
$347,800
Available: Right Now
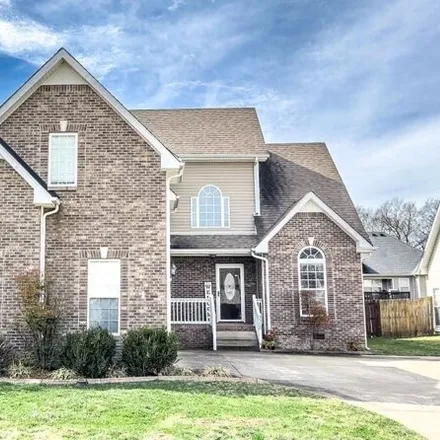
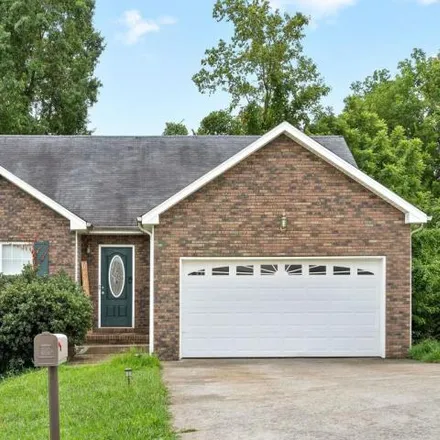
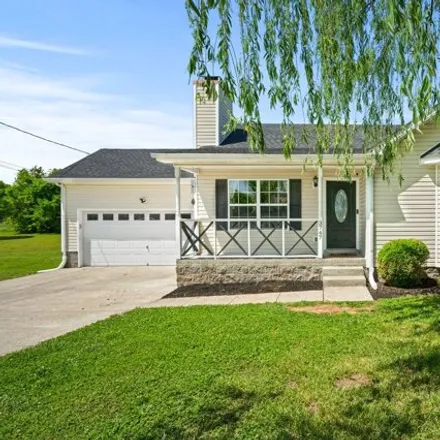
This home has it all! A bonus room ! New HVAC, Less Than 10 Minutes to Ft Campbell, Close to the Highway, Unique Layout, Schools Are Close By, Less Than 10 Minutes to Shopping , real hardwood floors, Eat in and Formal Dining Areas, Fenc...
$535,000
$535,000
Available: Right Now
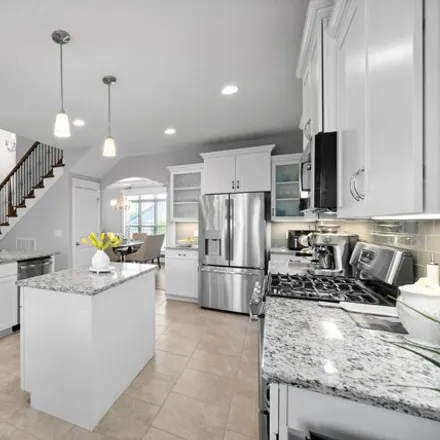
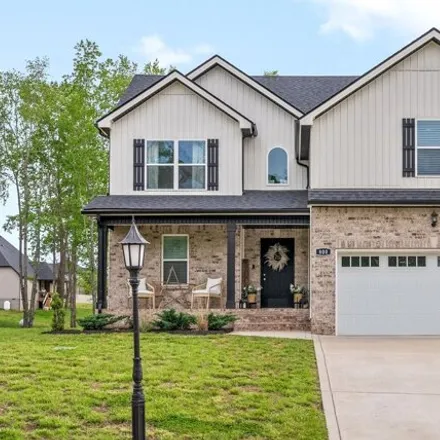
Like new home in the highly sought after Farmington Subdivsion. The community has neighborhood ponds, a playground, basketball court, walking paths, and more! This home will be zoned Kirkwood Elementary in the fall of 24. This home is located just mi...
$265,000
$265,000
Available: Right Now
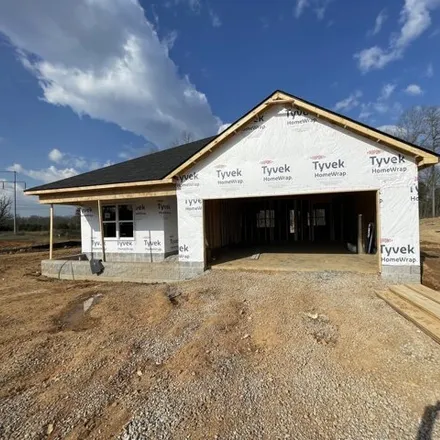
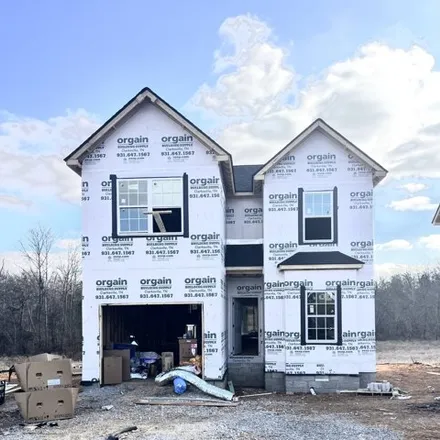
This fresh construction gem is perched at the end of the street, offering 3 beds, 2.5 baths, and a whopping.55-acre lot. Inside, enjoy the sleek vibe with spacious living and designer finishes. But the real magic happens outside, where you're treated...

$350,000
$350,000
Available: Right Now
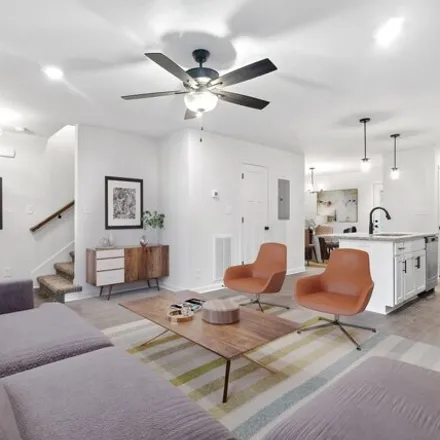
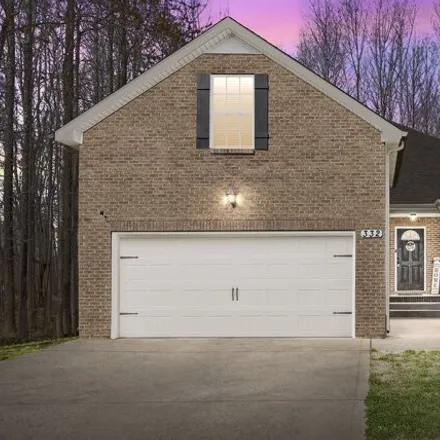
Discover elegance and modern charm in this beautifully revamped two-story home. Enjoy the cozy fireplace-lit living room and gourmet kitchen, adorned with granite countertops, and stainless steel appliances. Relish the new waterproof Luxury Vinyl Til...
$250,000
$250,000
Available: Right Now
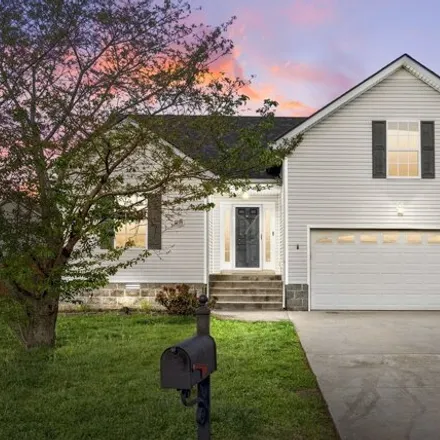
Beautiful home with spacious living areas. The living room has a vaulted ceiling and fireplace. The kitchen has lots of storage space. Primary bedroom has vaulted ceilings with en suite bathroom with separate shower and tub and double vanities. Enjoy...
$425,000
$425,000
Available: Right Now
Welcome to your dream home! The combination of spacious living areas, front porch, and a covered back deck offers plenty of opportunities for relaxation and entertainment. The large lot provides privacy and room to enjoy outdoor activities. The open ...
$329,900
$329,900
Available: Right Now
Welcome to the single-level charm of the Roxy, a copyrighted floor plan by Hawkins Homes. This 3-bedroom ranch invites you with 9 ft. ceilings in the main living area, creating an open and airy atmosphere. The large kitchen boasts an oversized island...
$335,000
$335,000
Available: Right Now
Beautiful home in Chestnut Grove with a great bonus room and an incredible backyard is available now. All bedrooms located on the main level with the bonus room located upstairs above the garage. Nice large living room with tray ceiling is open to th...

$369,900
$369,900
Available: Right Now
Welcome to your own private oasis nestled along the banks for the Red River! This charming home features three generously sized bedrooms, each offering a peaceful retreat for rest and relaxation. Fresh Paint, New Carpet, New engineered hardwood floor...
$329,900
$329,900
Available: Right Now
Welcome to this exquisite home showcasing 4 spacious bedrooms, 3 full baths, and a convenient 1-car garage. Situated in close proximity to Fort Campbell, this residence offers easy access for military personnel. The primary suite is thoughtfully loca...
$279,900
$279,900
Available: Right Now
Wanna be close to shopping, restaurants, and the interstate? This Clarksville home nestled in the desired Hazelwood Subdivision that sits back in a cul-de-sac is the answer. It's also easy access to Fort Campbell located off Exit 1. This home feature...

$288,000
$288,000
Available: Right Now
If you are looking for space, this is the ONE! 2 bedrooms on the main floor and Bonus room with a mini kitchen! Large fenced in backyard and Shopping/ Ft Campbell at your fingertips! Upstairs has 2 full bedrooms one of those has a large office space ...

$494,950
$494,950
Available: Right Now
Move in ready spacious home in The Oaks on Dunbar Cave Rd. It features a Main floor owner 'S SUITEwith a large shower, standalone tub, and walk-in closet with custom shelving. The open concept living area seamlessly connects to the dini...
$310,000
$310,000
Available: Right Now
Lovely updated ranch home with tall ceilings, large upstairs bonus, gorgeous vaulted living room, spacious kitchen with a ton of cabinetry for storage, tree lined backyard with above ground pool. Over 1800sf in established, sought after neighborhood ...
$228,000
$228,000
Available: Right Now
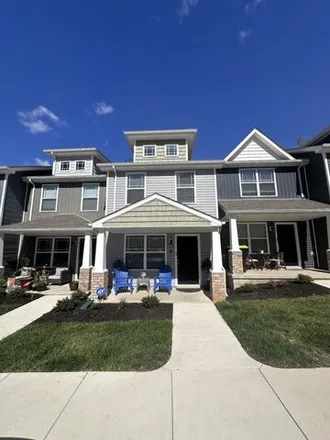
Beautiful Townhome, Close to shops, restaurants, ASPU.Spacious Living and dining areas - kitchen with all stainless steel appliances and granite countertops, private patio w/storage closet off the kitchen, 1/2 bath down, 2 bedrooms up each with their...

$330,000
$330,000
Available: Right Now
Beautiful home close to Ft. Campbell, I24, and shopping. This home features a Main Bedroom w/ walk-in closet and separate ensuite w/ separate shower and tub, and double vanities. Half bath downstairs and all three bedrooms upstairs. Level backyard wi...

$425,000
$425,000
Available: Right Now
Immerse yourself in the epitome of luxurious living within a secure, gated community. This 3-bedroom, 2.5-bath brick home boasts2, 385sq ft of elegance with a charming, cozy feeling, and soaring high ceilings. The main level features hardwood floorin...

$298,000
$298,000
Available: Right Now
Welcome to your fairytale dream home! With an inviting exterior that matches a Brand-new interior. This open concept will keep the conversations lively throughout your new floors, walls, and new kitchen. Enjoy this open hosting space that ties...

$525,000
$525,000
Available: Right Now
900 Hogan Rd is a charming property nestled on 5.3 acres of land, boasting refinished hardwood floors, elegant granite countertops, and modern stainless steel appliances. The home features a spacious partially covered rear patio with a built-in barbe...

$770,000
$770,000
Available: Right Now
Buyer financing fell through !! Welcome to your dream investment! This barely 1-year-old townhome boasts all-brick elegance, featuring a meticulously crafted one 2-bed, 2.5-bath unit spanning 1154 sq ft and two 3-bed, 2.5-bath units each offer...
$848,000
$848,000
Available: Right Now
Spectacular property features modern luxury on a cul-de-sac street in the highly sought after Sango neighborhood of Savannah Glen-The pristine living space features vaulted ceilings and an open design seamlessly connecting the living, dining and kitc...
Clarksville
According to statistics, the population in Clarksville, TN amounts to 147,771, which shows growth 1% compared to the previous year. The median age of the city’s residents is 29. The average household income is $51,164, shifting growth 5% from the past year, and the average property value in Clarksville, TN growth 2% to $143,400 throughout the year.
| Population | 147,771 |
| Median Age | 29.4 |
| Poverty Rate | 15% |
| Household Income | $51,164 |
| Number Of Employees | 58,682 |
| Median Property Value | $143,400 |
What is the Average Price of Apartments for Sale in Clarksville, TN?
| Month | Median Price |
|---|---|
| Apr 2024 |
$215,864
|
| Mar 2024 |
$215,864
|
| Feb 2024 |
$215,864
|
| Jan 2024 |
$215,864
|
| Dec 2023 |
$183,446
|
| Nov 2023 |
$195,548
|
| Month | Median Price |
|---|---|
| Apr 2024 |
$326,545
|
| Mar 2024 |
$312,245
|
| Feb 2024 |
$312,245
|
| Jan 2024 |
$312,245
|
| Dec 2023 |
$320,351
|
| Nov 2023 |
$319,926
|
Household Income
The average household income in Clarksville, TN grew from $48,675 to $51,164 in the past year. This data is an estimate based upon 53,525 households in Clarksville, TN . The chart below presents how household income is distributed in Clarksville, TN in comparison to the revenue allocation amid households nationally.
Property Value
According to data from last year, the average property value in Clarksville, TN shifted from $140,000 to $143,400 throughout the year. The subsequent graph indicates the share of properties in the given price range in Clarksville, TN in comparison to the median property value in the same price segment across the country. According to the data, the greatest share of Clarksville, TN properties falls in the '$150,000 to $174,999' range, which is lower than the most significant median property across the country.
Rent vs. Own
Property Taxes
One of the most important aspects for property owners is the amount of property taxes. This graph shows distribution of property taxes in Clarksville, TN compared to median property taxes around the country. The prevalent amount of property taxes in Clarksville, TN equals $1150, which is less than the national average.