Clayton, NC, USA apartments for sale
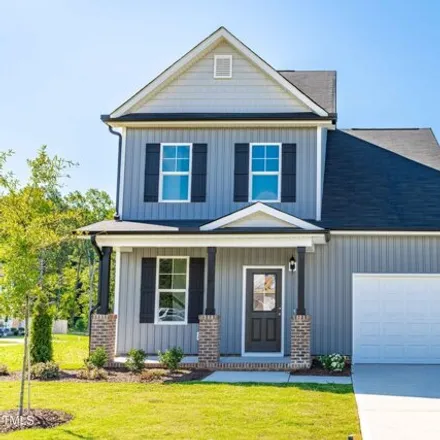
$357,900
$357,900
Available: Right Now
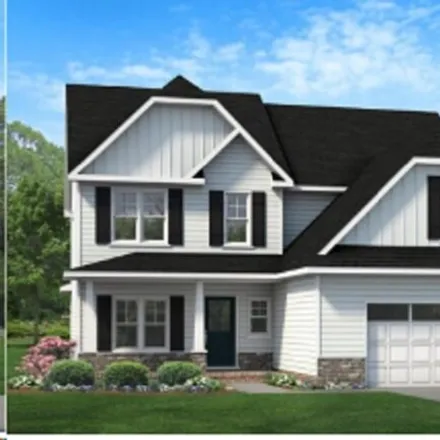
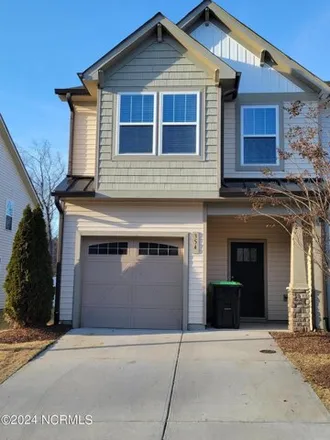
Don't miss this gorgeous Sequoia floor plan on a corner lot in the O'Neil Overlook community in downtown Clayton! Large foyer opens into the beautiful kitchen, dining, living room area. Main suite with huge walk in closet, double sink vanity and 5ft ...
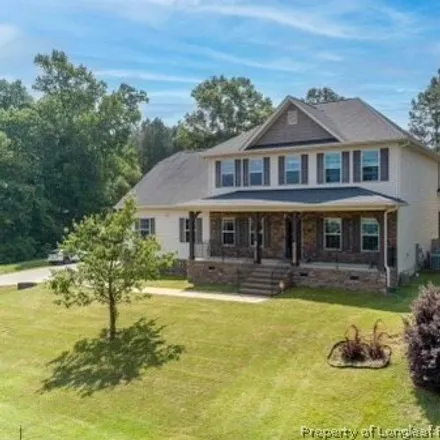
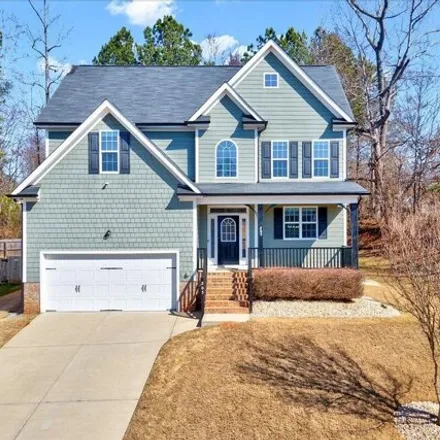
$515,000
$515,000
Available: Right Now
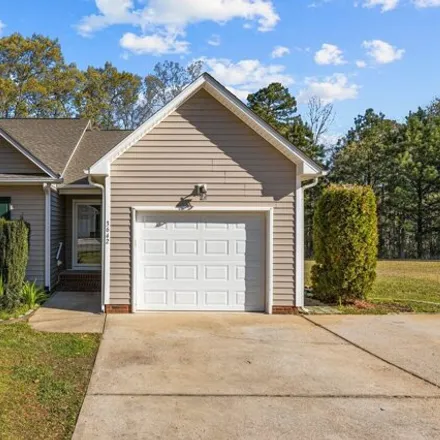
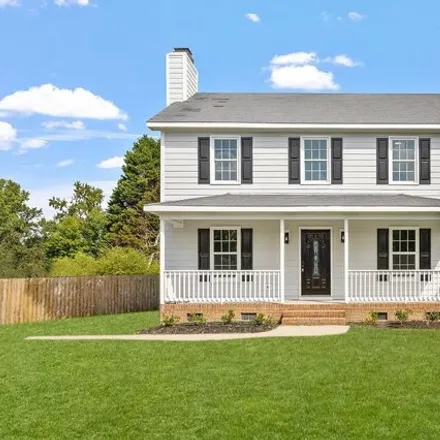
This beautiful home sits on a corner lot, is priced to sell and a must see! It has everything you could want in a home with the master bedroom on the main floor, three bedrooms plus a bonus with a closet upstairs so you could have 5 bedrooms. There i...
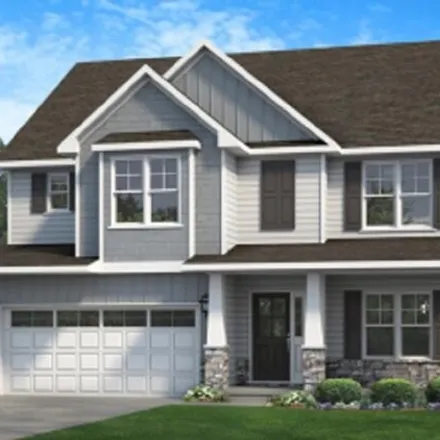
$479,706
$479,706
Available: Right Now
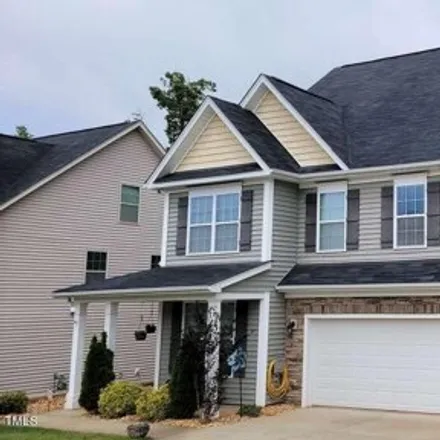
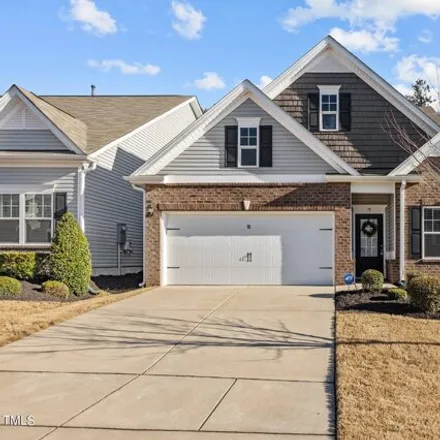
The Gavin ll offers 3 bedrooms and a finished bonus room on 2nd floor. DR has 5' tall wainscotting and the kitchen boasts quartz, s/s appliances, large island, and breakfast nook. Kitchen opens to family room for easy entertaining. Laminate hardwoods...
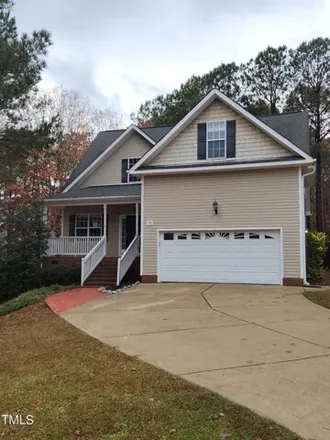
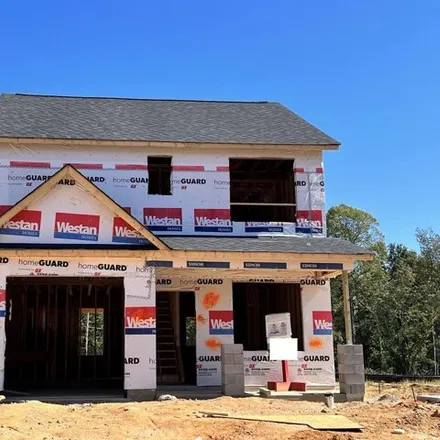
$399,900
$399,900
Available: Right Now
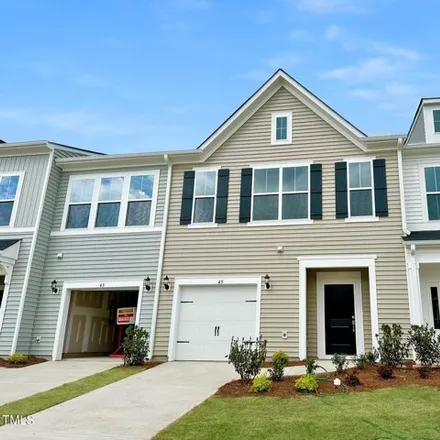
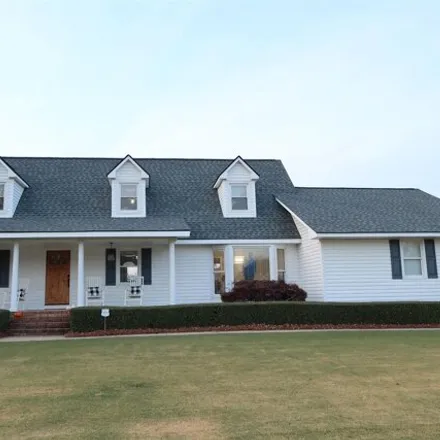
Custom-built4 BR, 2.5baths, 2063 s.f. in Flowers Plantation. Master BR on main level, rocking chair front porch, Hardwood floors throughout main level . open floor Plan w/Upgraded kitchen has gas range, stainless steel appliances, solid surfac...
$449,900
$449,900
Available: Right Now
A must see 5-bed, 3.5-bath three-story transitional home nestled within the sought-after Riverwood Athletic Club community! Brand new HVAC system and freshly painted walls throughout the entire interior. Luxurious engineered hardwoods grace the kitch...
$329,900
$329,900
Available: Right Now
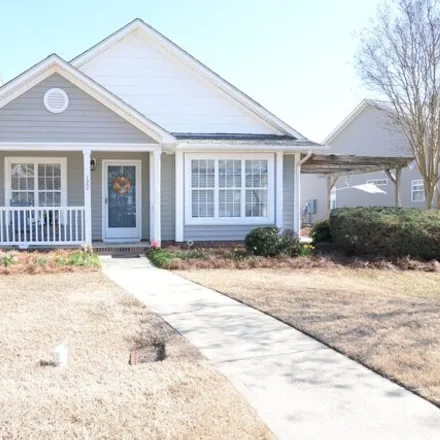
Schedule your tour of this beautiful new home in Clayton's Ashcroft community! Spacious dining room opens into the beautiful kitchen with large island and stainless steel appliances. Living room with cozy electric fireplace. Gorgeous main suite with ...
$355,000
$355,000
Available: Right Now
Hurry while it lasts. This well kept 2 story is within a quick distance to downtown. Large open family room with updated flooring and well appointed natural gas log fireplace surrounded by custom built shelving. Dining area can hold a large table wit...
$550,000
$550,000
Available: Right Now
Unique home with beautiful backyard on the 18th fairway of Pine Hollow Golf Course. Enjoy the views from your back deck looking over the large in ground pool. Home has 3 full baths with 2 master bedroom setups. Wooded and open areas allow for great s...
$484,706
$484,706
Available: Right Now
The Naples plan offers spacious living w/ 1st floor master bedroom and 3 generous sized bedrooms and a bonus room upstairs. Master bath w quartz counters, separate shower, garden tub and walk-in closet. Laminate hardwoods throughout 1st floor living ...
$334,900
$334,900
Available: Right Now
Schedule your tour of this beautiful new home in Clayton's Ashcroft community! Spacious dining room opens into the beautiful kitchen with large island and stainless steel appliances. Living room with cozy fireplace. Gorgeous main suite with walk in c...
$311,000
$311,000
Available: Right Now
Welcome to this stunning property with a natural color palette that creates a relaxing atmosphere throughout. The kitchen showcases a center island, perfect for meal prep or casual dining. The spacious master bedroom boasts a walk-in closet for all y...
$339,900
$339,900
Available: Right Now
Indulge in a beautiful expanse of cabinetry and granite countertops in this exquisite new-build home. This gorgeous residence highlights classic comforts: enjoy a open living room featuring a cozy fireplace, large bar island and main suite with 5ft s...
$304,980
$304,980
Available: Right Now
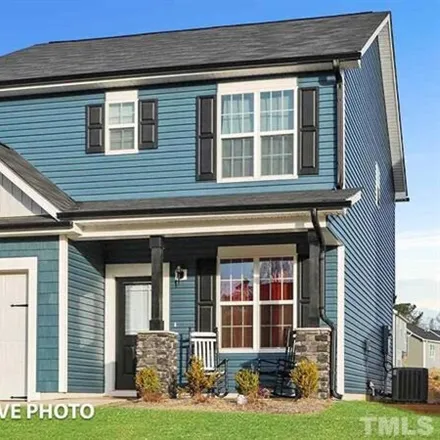
This Beautiful town home is located in the very desirable Flowers Plantation and is an end unit and has many upgrades. The home comes with 2 parking spots as well as the garage and guest parking. Once you enter the foyer with the tall ceilings you wi...
$325,000
$325,000
Available: Right Now
Charming 3bd/2ba one-story townhome with an open floor plan and one car garage. The interior is freshly painted and has a new storm door, new SS microwave and new SS stove. Off of the kitchen, the spacious dining room and living room are perfect for ...
$629,900
$629,900
Available: Right Now
Stunning foyer and formal wainscotted dining room. Carpeted front office has French doors with lots of natural light. Spacious living room has gas fireplace. Eat in kitchen area leads to the spacious kitchen with stainless steel appliances and an isl...

$125,000
$125,000
Available: Right Now
Excellent opportunity to own private lots within walking distance to downtown Clayton! Several infill lots next to Fellowship Baptist Church. Uninhabitable living structure (tear down) and 2 storage/sheds/barns (tear down) on property. Best use of th...
$275,000
$275,000
Available: Right Now
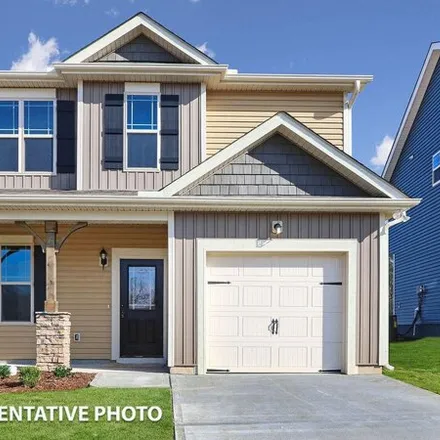
Clayton's Best value ! The modern twist on a classic townhome offersGARAGE,two secondary bedrooms and bath on main floor along with covered PATIO! Upstairs hosts Primary Bedroom, Living/Dining and Kitchen plusSUN DECK! 9' ceilings on both floo...
$334,900
$334,900
Available: Right Now
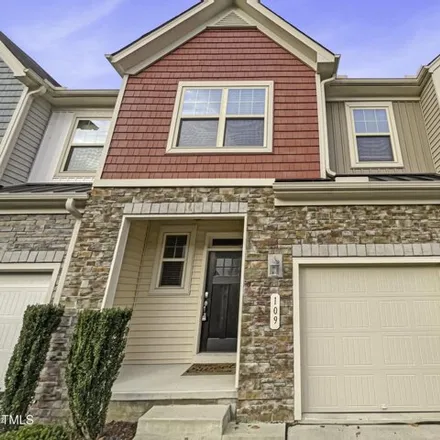
3 Bedroom 2 Bath end unit townhome in Moss Creek Village! Vaulted ceiling in living room with built in shelving. Hardwoods throughout main common areas and carpet in bedrooms. Large primary bedroom with dual vanity sinks, walk-in closet and walk-in s...
$569,900
$569,900
Available: Right Now
Welcome home to this beautiful, spacious home!! Great location outside of Clayton city limits. Offers an entrance from Amelia Church Road and Guy Road, making it very accessible to downtown Clayton and US 70 Business HWY!!!! Enjoy this 1+ acre...
$395,000
$395,000
Available: Right Now
Back on the market !! (Previous Buyers Financing Fell Through.) This is the home in Flowers Plantation you've been waiting for! With a Primary br on the main level, 2- car garage, flex/bonus room to potentially use as a 4th Br, backy...
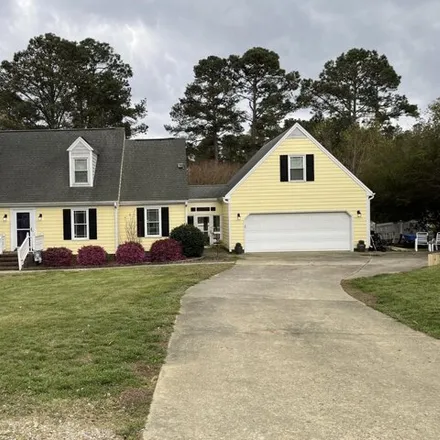
$349,000
$349,000
Available: Right Now
Completely renovated and move-in ready! Welcome to this beautifully renovated house that is nestled on a fenced-in lot that is just shy of 1 acre. Brand new everything! A few updates include 2 brand-new HVAC systems with new duct work. Stunning custo...
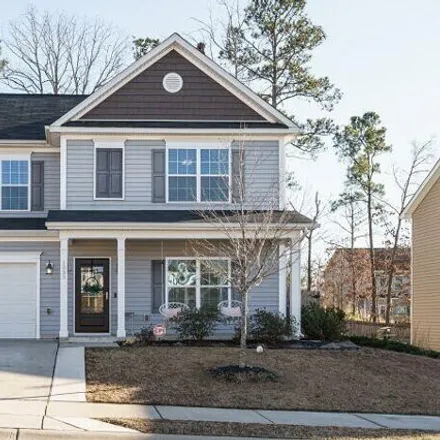
$349,900
$349,900
Available: Right Now
Beautiful 3 bed, 2.5 bath two-story home located in the popular Creekside Commons neighborhood of Clayton is NOW available! This home has much to be desired with its endless amount of curb appeal, it's lovely bright and open floor-plan with fi...
Clayton
According to statistics, the population in Clayton, NC amounts to 19,306, which shows growth 4% compared to the previous year. The median age of the city’s residents is 34. The average household income is $59,338, shifting decline -3% from the past year, and the average property value in Clayton, NC growth 3% to $166,800 throughout the year.
| Population | 19,306 |
| Median Age | 34.3 |
| Poverty Rate | 9% |
| Household Income | $59,338 |
| Number Of Employees | 8,983 |
| Median Property Value | $166,800 |
What is the Average Price of Apartments for Sale in Clayton, NC?
| Month | Median Price |
|---|---|
| Apr 2024 |
$343,342
|
| Mar 2024 |
$343,342
|
| Feb 2024 |
$343,342
|
| Jan 2024 |
$343,342
|
| Dec 2023 |
$270,961
|
| Nov 2023 |
$391,750
|
| Month | Median Price |
|---|---|
| Apr 2024 |
$470,138
|
| Mar 2024 |
$470,138
|
| Feb 2024 |
$470,138
|
| Jan 2024 |
$470,138
|
| Dec 2023 |
$666,025
|
| Nov 2023 |
$408,707
|
Household Income
The average household income in Clayton, NC declined from $60,989 to $59,338 in the past year. This data is an estimate based upon 6,618 households in Clayton, NC . The chart below presents how household income is distributed in Clayton, NC in comparison to the revenue allocation amid households nationally.
Property Value
According to data from last year, the average property value in Clayton, NC shifted from $162,000 to $166,800 throughout the year. The subsequent graph indicates the share of properties in the given price range in Clayton, NC in comparison to the median property value in the same price segment across the country. According to the data, the greatest share of Clayton, NC properties falls in the '$125,000 to $149,999' range, which is lower than the most significant median property across the country.
Rent vs. Own
Property Taxes
One of the most important aspects for property owners is the amount of property taxes. This graph shows distribution of property taxes in Clayton, NC compared to median property taxes around the country. The prevalent amount of property taxes in Clayton, NC equals $2500, which is less than the national average.