Crossville, TN, USA apartments for sale

$164,900
$164,900
Available: Right Now
Welcome to 906 Nameoki Circle, an affordable housing option with the amenities of Lake Tansi. This 2 bedroom 1 bath house sits on a slab and features a new roof and vinyl siding. A double lot gives you a large wooded front yard with room for addition...
$229,000
$229,000
Available: Right Now
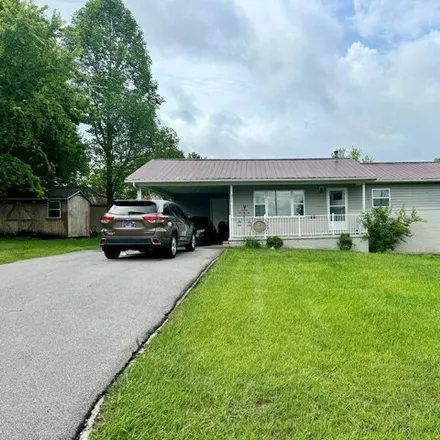
Charming and well-maintained! Would make a great starter home. Recent upgrades include a new water heater, windows, doors, and kitchen appliances in past 6/7 years. Features a metal roof, natural gas central heating, crown molding throughout, a one-c...

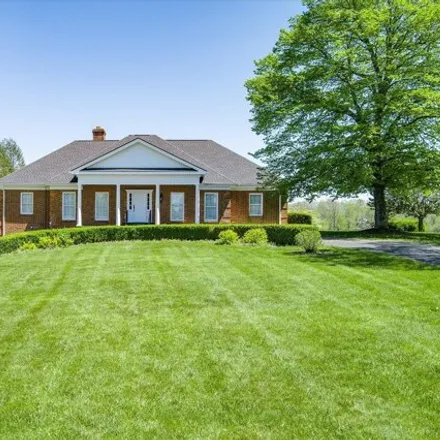
$429,000
$429,000
Available: Right Now
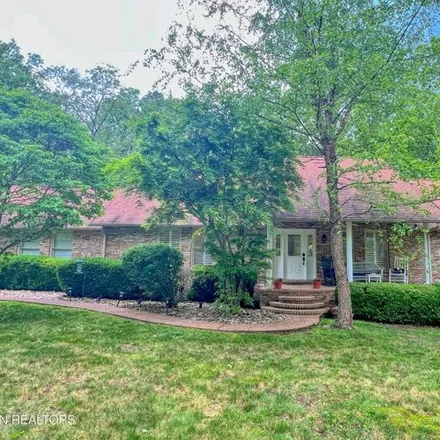
Beautiful brick home on quiet cul de sac. 3br. 2.5 ba. has1, 973sq feet on heated living area, with sunroom with a back up nat.gas heat. Large great room with crown molding and gas fireplace. The kitchen features ample oak cabinets, with island, over...
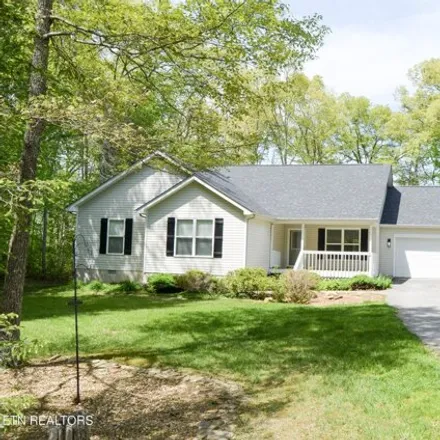
$299,000
$299,000
Available: Right Now
Welcome to your peaceful retreat close to town with a country setting! This charming 4 bedroom, 2 bath home boasts 1631 sq feet of cozy living space, complete with a rustic fireplace perfect for chilly evenings. Step outside and you'll find a spaciou...
$318,000
$318,000
Available: Right Now
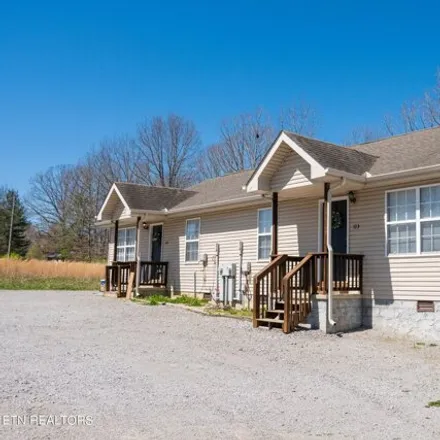
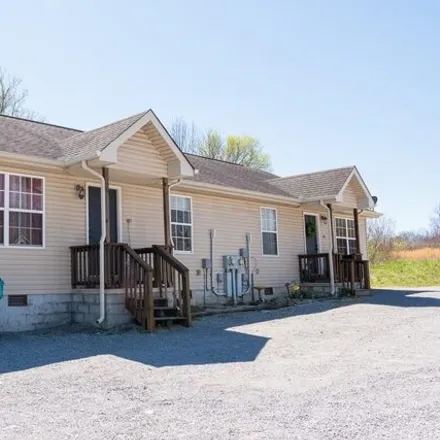
Investment opportunity that doesn't come very often. This duplex, completely remodeled in 2019, with newer flooring, updated kitchen cabinets, newer roof, gutters, water heater, bathroom updates and more is located in a quiet neighborhood inside the ...
$375,000
$375,000
Available: Right Now
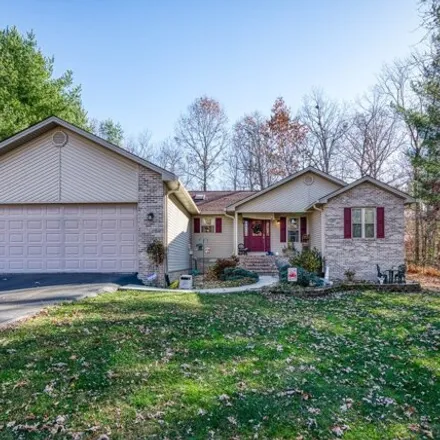
A covered front porch extends a warm welcome, flanked by a sprawling front yard and a convenient 2-car garage, offering shelter on inclement days. Stepping inside, you'll be captivated by the grandeur of cathedral ceilings, the hardwood flooring, and...

$365,000
$365,000
Available: Right Now
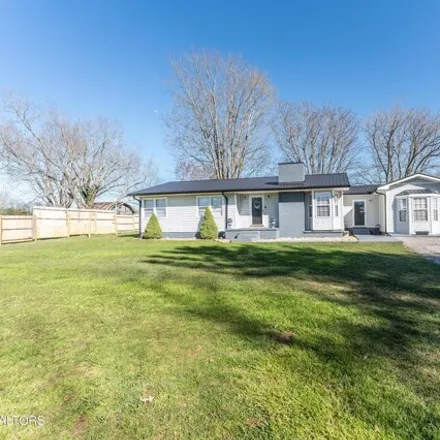
Charming 4-Bedroom Ranch in Crossville, Tennessee Welcome to your dream home! This beautifully updated 4-bedroom, 2-bathroom ranch in Crossville, Tennessee has everything you need for modern living. Key Features Open Concept Living - Enjoy spacious a...
$1,2M
$1,2M
Available: Right Now
Location ! Location ! Location ! ThisUNIQUEopportunity in Homestead sitting on 14+ acres is sure to impress with its Mountain views and so much more! Located across from the Cumberland Mountain State Park; this one owner, ...

$575,000
$575,000
Available: Right Now
Residential or Commercial Area- Currently being used as office but easily adaptable to a Beautiful Home. Or have a Business or Office and Residence together. All Brick, Large Rooms. 9 and 12 foot ceilings, Hardwood and tile throughout. Excellent cond...

$205,000
$205,000
Available: Right Now
Take a look at this Newly updated 3 bed, 1 bath home on 1/3 acre lot! Location: Conveniently located in town Updates: new roof, vinyl siding, vinyl windows, gutters, and stucco foundation Fresh paint and luxury vinyl plank (LVP) ...

$425,000
$425,000
Available: Right Now
Welcome home to this 2 story basement ranch home that has the best of both worlds! Located 5 minutes from town with a country setting. Featuring 4 bedrooms, 2.5 baths, fenced in back yard, a large walkout basement that has been plumbed for a bathroom...
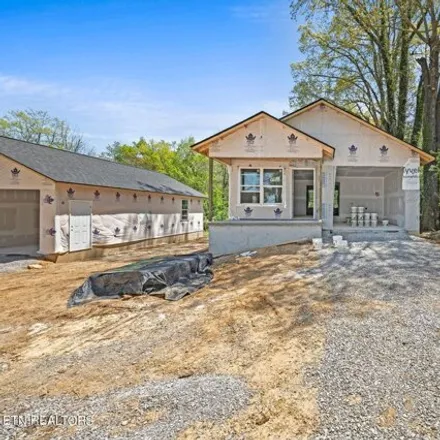
$235,000
$235,000
Available: Right Now
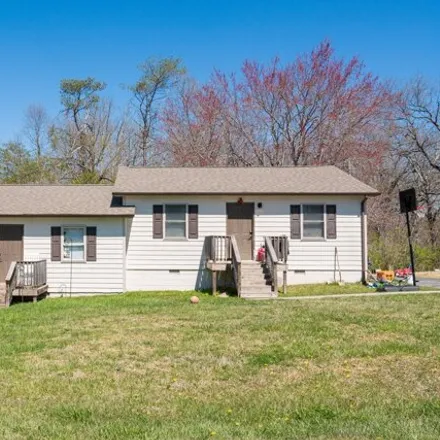
Step into the future of fine living with this beautifully designed 2-bedroom, 1-bath home nearing completion in just 3-4 weeks. Nestled within the city limits, this property offers the convenience of city water, sewer, and trash services. Relax on th...
$449,000
$449,000
Available: Right Now
Great location with lots ofPRIVACYfor this 3 bedroom, 2 bath 1949 sq ft home on over 1 acre. Open concept living room and kitchen area with cathedral ceiling and fireplace. Nicely sized bedrooms, oversized garage with bonus unfinished room abo...
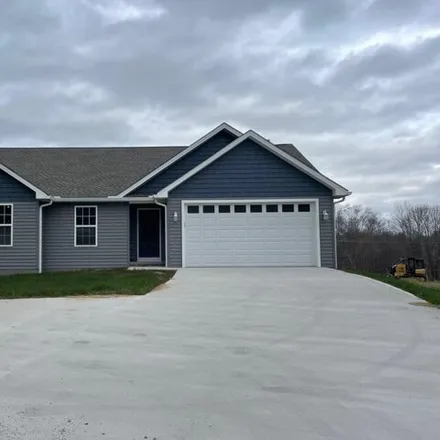
$329,900
$329,900
Available: Right Now
Fabulous New Construction in Convenient location, close to Hospital and Shopping. This 3 bedroom, 2 bathroom home is situated in the heart of the city with all the conveniences nearby. As you step inside, you'll love the luxurious vinyl plank floorin...

$289,900
$289,900
Available: Right Now
3 Bedroom, 2 bath1, 752sq. foot house situated on 1.12 acres bordering little Obed River. Basement area ideal for family room or home office. Seller requests buyers to have letter of pre-qualification or proof of funds before viewing. Offers written ...

$318,000
$318,000
Available: Right Now
Investment opportunity that doesn't come very often. This duplex, completely remodeled in 2019, with newer flooring, updated kitchen cabinets, newer roof, gutters, water heater, bathroom updates and more is located in a quiet neighborhood inside the ...
$464,000
$464,000
Available: Right Now
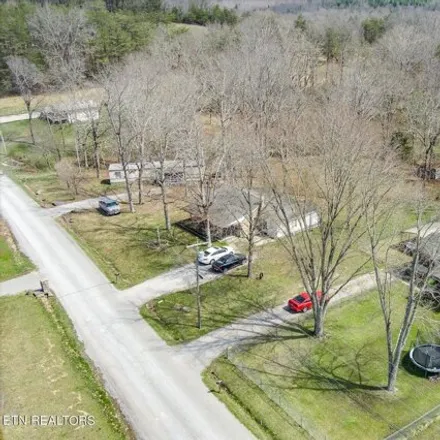
So many possibilities for this unique property! This multi-family set up consists of 3 separate residences with their own utility hookups and septic systems and are all currently rented out! Creek runs along the side of the property and large back ya...
$565,000
$565,000
Available: Right Now
This beautiful brick home sits on a spacious 1-acre corner lot in the highly desirable Laurelwood Subdivision. A sought after location due to the proximity of town, large yards, and no city property taxes! With2, 363sq ft, 3 beds, 3 full baths and al...

$235,000
$235,000
Available: Right Now
Excellent investment opportunity! Property is zoned commercial and would be great for a home based business with great road frontage(approx. 174') Surrounded by commercial properties and close proximity to Lake Tansi. Less than 2.5 miles from downtow...
$639,500
$639,500
Available: Right Now
Profitable Fourplex with additional space to build more units, inside Crossville city limits. 3 units are occupied and the 4th unit has had a partial upgrade with new kitchen cabinets, appliances, newer HVAC and lighting, but still needs to be finish...

$419,000
$419,000
Available: Right Now
Very well maintained home on over 1/2 acre in town ! This Spacious2, 066SqFt. Split bedroom floor plan design is loaded with updates and features! Some of the resent updates (since Feb 2023) include - Tankless N.Gas water heater, New windows, ...
$639,500
$639,500
Available: Right Now
Profitable Fourplex with additional space to build more units, inside Crossville city limits. 3 units are occupied and the 4th unit has had a partialupgradewithnew kitchen cabinets, appliances, newer HVAC and lighting, but still needs to be finished....
Crossville
According to statistics, the population in Crossville, TN amounts to 11,284, which shows decline 0% compared to the previous year. The median age of the city’s residents is 37. The average household income is $29,183, shifting growth 9% from the past year, and the average property value in Crossville, TN growth 2% to $139,300 throughout the year.
| Population | 11,284 |
| Median Age | 36.6 |
| Poverty Rate | 31% |
| Household Income | $29,183 |
| Number Of Employees | 3,850 |
| Median Property Value | $139,300 |
What is the Average Price of Apartments for Sale in Crossville, TN?
| Month | Median Price |
|---|---|
| Jun 2024 |
$353,311
|
| May 2024 |
$272,042
|
| Apr 2024 |
$468,221
|
| Mar 2024 |
$468,221
|
| Feb 2024 |
$468,221
|
| Jan 2024 |
$468,221
|
| Month | Median Price |
|---|---|
| Jun 2024 |
$375,873
|
| May 2024 |
$316,823
|
| Apr 2024 |
$449,171
|
| Mar 2024 |
$449,171
|
| Feb 2024 |
$449,171
|
| Jan 2024 |
$449,171
|
Household Income
The average household income in Crossville, TN grew from $26,675 to $29,183 in the past year. This data is an estimate based upon 4,571 households in Crossville, TN . The chart below presents how household income is distributed in Crossville, TN in comparison to the revenue allocation amid households nationally.
Property Value
According to data from last year, the average property value in Crossville, TN shifted from $136,900 to $139,300 throughout the year. The subsequent graph indicates the share of properties in the given price range in Crossville, TN in comparison to the median property value in the same price segment across the country. According to the data, the greatest share of Crossville, TN properties falls in the '$125,000 to $149,999' range, which is lower than the most significant median property across the country.
Rent vs. Own
Property Taxes
One of the most important aspects for property owners is the amount of property taxes. This graph shows distribution of property taxes in Crossville, TN compared to median property taxes around the country. The prevalent amount of property taxes in Crossville, TN equals $800, which is less than the national average.