Danville, KY, USA apartments for sale
$249,000
$249,000
Available: Right Now
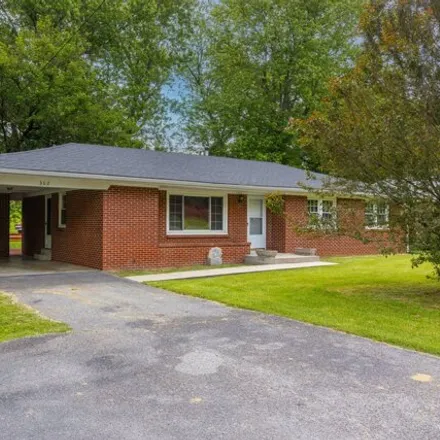
Danville - Downtown area. Are you looking for single floor living? Do you dream of sitting in the shade of an overside deck watching the birds play and relaxing with friends or family? Would you love a.5-acre lot with access to an orchard with Cherry...

$210,000
$210,000
Available: Right Now
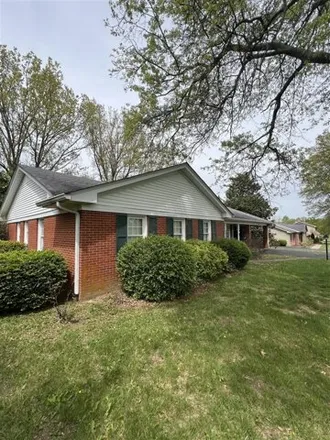
This all brick ranch has been beautifully updated and is ready for you to call it home! Offering 3 cozy bedrooms, an elegantly remodeled bathroom and stunning remodeled kitchen, this home is perfect for blending functionality with style. Step inside ...

$215,000
$215,000
Available: Right Now
This charming home has been wonderfully updated and is ready for its new owner! New roof 2024, redone front porch, new storm doors, fresh paint and many other features make this home move in ready. From the refinished original hardwood floors to the ...
$235,000
$235,000
Available: Right Now
Fall in love with this gorgeous and spacious remodeled home. This house features 3 bedrooms, 11/2 baths. Big kitchen with an island to entertain friends and family. New Stainless steel appliances.New A/C and heating system. New flooring, new light fi...

$180,000
$180,000
Available: Right Now
Welcome to downtown Danville living at its finest! This charming 3-bedroom, 2-bathroom home boasts a spacious primary bedroom on the ground floor, along with two additional bedrooms and a dedicated bathroom upstairs. Enjoy ample space in the large li...
$269,000
$269,000
Available: Right Now
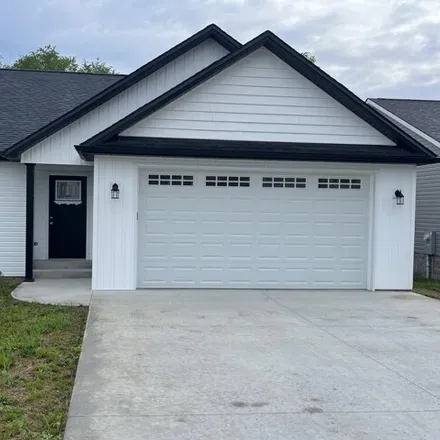
Discover modern living in this brand-new construction boasting1, 745square feet. With 3 bedrooms and 2 baths, this home offers the perfect blend of comfort and style. Indulge your culinary desires in the inviting kitchen, complete with granite counte...

$229,000
$229,000
Available: Right Now
Enjoy maintenance free living in this adorable condo. Features: Living room with vaulted ceilings/skylight. Gas log fireplace. Formal dining area and a breakfast nook area in kitchen. Gally kitchen with stone back splash. All appliances are included....

$619,000
$619,000
Available: Right Now
Custom built by Bob Lawson. Lot offer mature trees and privacy quietly located on a cul-de-sac in Williamsburg Village, a short golf cart ride away from Danville Country Club! Full finished walk-out basement with in-law suitethat offers a den, kitche...
$167,500
$167,500
Available: Right Now
You can be at class at Centre College before your first cup of coffee kicks in! This investor's gem has private entrance/exit for one of the bedrooms. Floors, kitchen, and bathroom remodeled in 2020. Fantastic rental, short term rental or parent's so...

$219,900
$219,900
Available: Right Now
Buyer was unable to finance Welcome to this fully renovated brick duplex, where classic charm meets modern luxury. Each unit offers1, 000sq ft of beautifully updated living space, designed to impress and provide comfort.As you approach, you'll...

$198,000
$198,000
Available: Right Now
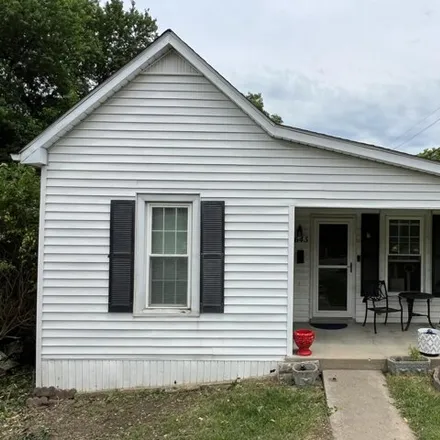
Take a look at this adorable, traditional Cape Cod home! Located close to Centre College and Danville's bustling downtown- its location is superb! Featuring hardwood floors, new carpet, four large bedrooms, two full bathrooms, new appliances, new kit...

$287,500
$287,500
Available: Right Now
This spacious, immaculately kept home is located in a quiet, well settled neighborhood. This home has been very well maintained with above average size rooms. There is beautiful hardwood floors in most of the rooms, with tile in the bathroom and lami...
$289,900
$289,900
Available: Right Now
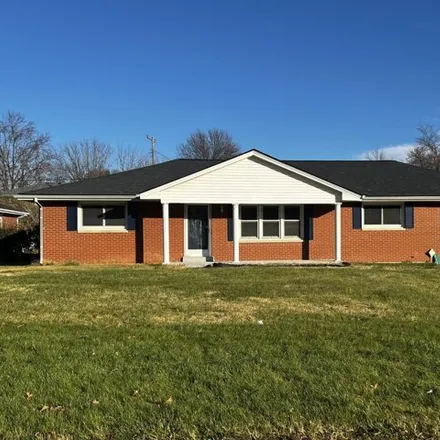
Talk about Location, you will love this solid well built brick ranch on nearly half an acre lot. This home with a little updating will be a showcase. There is ample space in the kitchen den combo that features a fireplace. Separate utility roo...
$310,000
$310,000
Available: Right Now
Don't miss this great opportunity to be within walking distance of Downtown Danville and Centre College! Enjoy all of the events, shopping, and restaurants that is offered! And being located next to Centre College and its fantastic programs just adds...

$359,000
$359,000
Available: Right Now
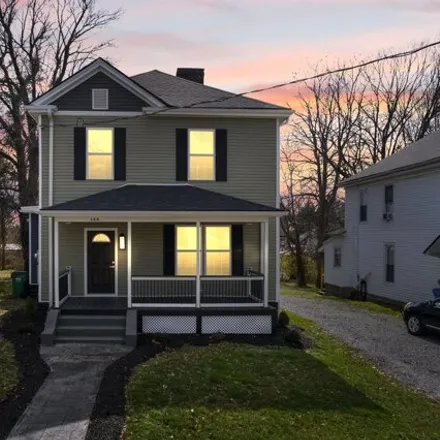
Welcome to 1490 Lannock Dr, Danville! This beautiful 4-bedroom, 2.5-bathroom home is situated on a spacious.42-acre lot, offering ample space and privacy. The property features a convenient 2-car garage, perfect for easy parking and storage. Located ...
$315,000
$315,000
Available: Right Now
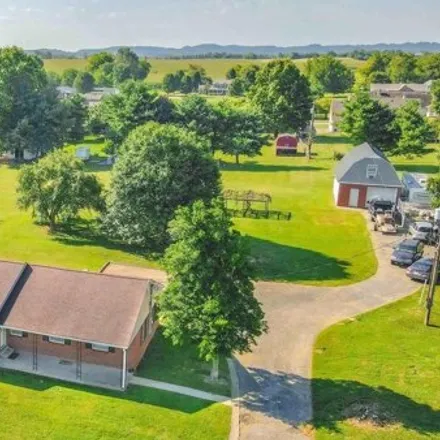
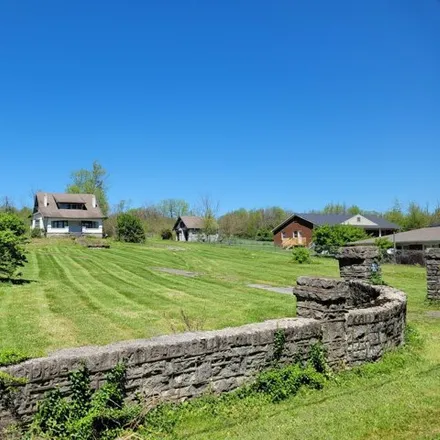
Situated in Boyle Co. on Perryville Rd., is this nice brick with 2.33 acres. Blacktop drive, 22 x 33 detached garage with apartment above. There is a 16 x 16 detached metal garage/shop. 10 x 12 storage shed. Home features: Living room/gas log firepla...
$319,500
$319,500
Available: Right Now
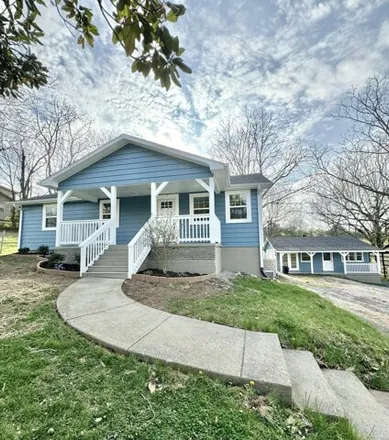
This Beauty is super close to all that Danville has to offer with that country feel as you sit on your back patio. Boasting 2 structures on the property with lots of potential. The 3 bedroom, 2 bath main home has been tastefully remodeled with an unf...
$429,900
$429,900
Available: Right Now
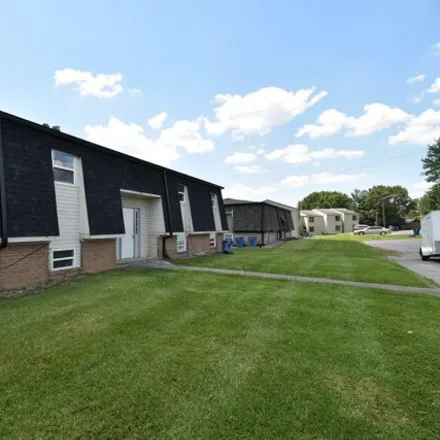
Discover this stunning, fully renovated, low-maintenance 4-plex, featuring over six figures in renovations and offering a total of4, 160sq ft of modern living space. Each unit has been meticulously updated with granite countertops, sleek nickel hardw...
$325,000
$325,000
Available: Right Now
Current owners got zoning changed to RM-3 which makes this an ideal (and rare) multi-family housing property. RM-3 allows up to 8 units per building (which would mean 62 units plus the home in place). This property is one of the only properties with ...
$398,000
$398,000
Available: Right Now
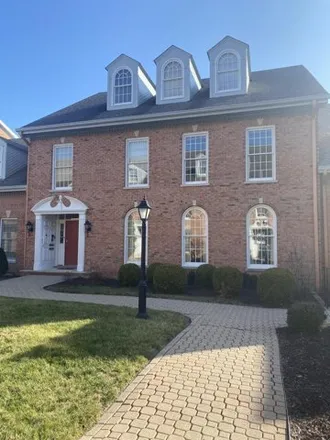
Welcome to your dream home, where every detail has been meticulously curated to exceed your expectations. This fully renovated gem boasts a design that surpasses anything you could have imagined, setting a new standard in luxury living. Located withi...

$199,900
$199,900
Available: Right Now
Located just a stone's throw from Centre College, this pristine property is move-in ready and waiting for its new owners. Whether you're looking for a comfortable home for yourself or a valuable addition to your investment portfolio, this property of...
$214,900
$214,900
Available: Right Now
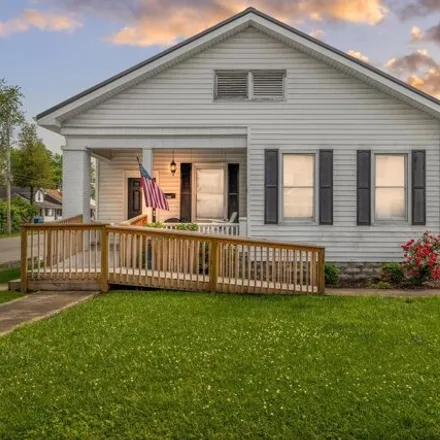
Discover the charm of downtown Danville living in this inviting4BR/2BAranch home nestled on a corner lot. Step onto the deep covered front porch and into the welcoming foyer, where hardwood floors lead you through a traditional floorplan. The den are...
Danville
According to statistics, the population in Danville, KY amounts to 16,657, which shows decline 0% compared to the previous year. The median age of the city’s residents is 37. The average household income is $37,045, shifting decline 0% from the past year, and the average property value in Danville, KY growth 4% to $144,400 throughout the year.
| Population | 16,657 |
| Median Age | 36.6 |
| Poverty Rate | 19% |
| Household Income | $37,045 |
| Number Of Employees | 6,758 |
| Median Property Value | $144,400 |
What is the Average Price of Apartments for Sale in Danville, KY?
| Month | Median Price |
|---|---|
| Jun 2024 |
$333,976
|
| May 2024 |
$203,785
|
| Apr 2024 |
$318,210
|
| Mar 2024 |
$318,210
|
| Feb 2024 |
$318,210
|
| Jan 2024 |
$318,210
|
| Month | Median Price |
|---|---|
| Jun 2024 |
$619,527
|
| May 2024 |
$660,422
|
| Apr 2024 |
$603,250
|
| Mar 2024 |
$1,006,657
|
| Feb 2024 |
$1,006,657
|
| Jan 2024 |
$1,006,657
|
Household Income
The average household income in Danville, KY grew from $37,036 to $37,045 in the past year. This data is an estimate based upon 6,221 households in Danville, KY . The chart below presents how household income is distributed in Danville, KY in comparison to the revenue allocation amid households nationally.
Property Value
According to data from last year, the average property value in Danville, KY shifted from $138,600 to $144,400 throughout the year. The subsequent graph indicates the share of properties in the given price range in Danville, KY in comparison to the median property value in the same price segment across the country. According to the data, the greatest share of Danville, KY properties falls in the '$200,000 to $249,999' range, which is lower than the most significant median property across the country.
Rent vs. Own
Property Taxes
One of the most important aspects for property owners is the amount of property taxes. This graph shows distribution of property taxes in Danville, KY compared to median property taxes around the country. The prevalent amount of property taxes in Danville, KY equals $1150, which is less than the national average.