Flint, MI, USA apartments for sale
$155,000
$155,000
Available: Right Now
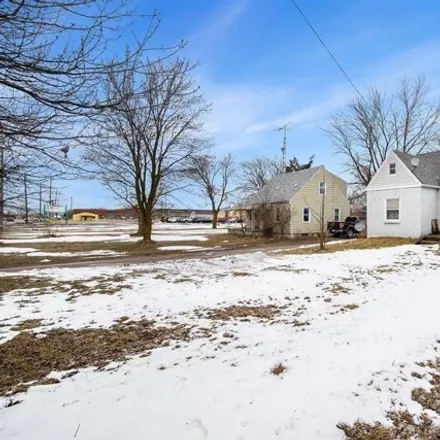
2 Houses - 1 Deal!!! 6000 and 6002 offer a great investment opportunity. We have improved the price on this family owned for generations packaged deal. Zoned GN-2. Shared Driveway and garage with6002 NDort Hwy and need to be sold together!!! Sold Wit...
$85,900
$85,900
Available: Right Now
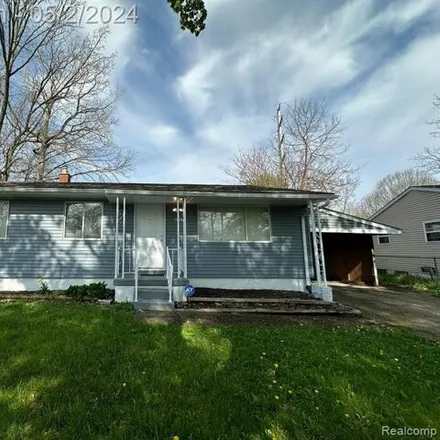
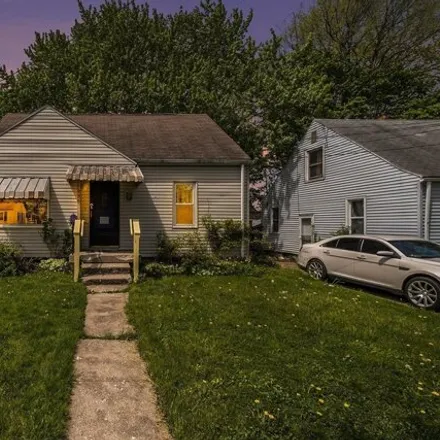
Welcome home !! This lovely 3 Bedroom Home hosts1, 100sq. ft. and brings with it some updates you'll love. Being just minutes away fromI-475,The Dort Federal Event Center, The Whiting Auditorium, The Sloan Museum, and the Award Winning Flint F...
$55,000
$55,000
Available: Right Now
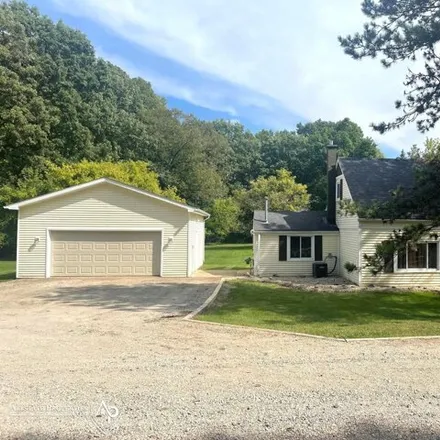
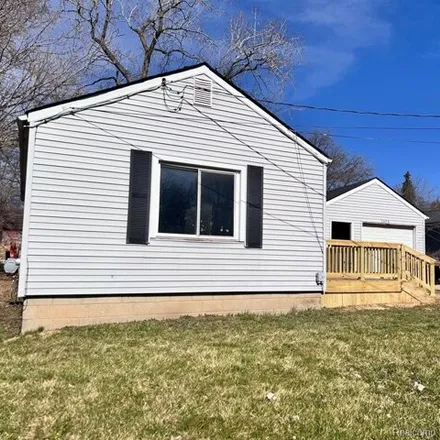
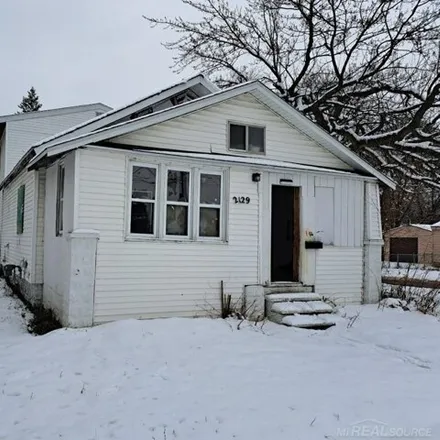
Updated 3 Bed, 1 bath home with large, updated eat in kitchen. 2 car garage and mud room. New roof and windows. Recently updated furnace and hot water heater. Central air conditioning. Home has fresh paint throughout and yard has already had its spri...
$70,000
$70,000
Available: Right Now
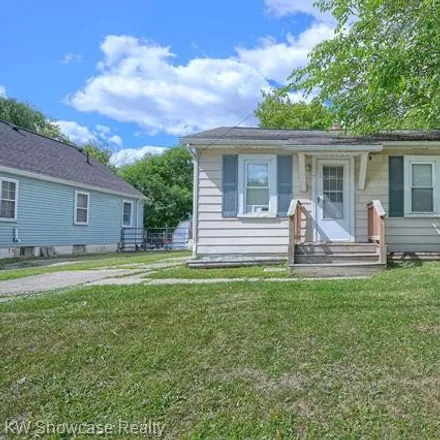
Welcome to this charming, fully updated home! Renovated in 2023, fresh with new paint, flooring, carpet, cabinets, trim throughout. The home offers peace of mind with a brand-new water heater, electrical system, and furnace. With a fenced-in yard, th...
$138,000
$138,000
Available: Right Now
2 story, 7 unit property in Flint. Each unit is 1 bedroom, 1 bath unit. Potential investment opportunity. Showings will be for vacant units and common areas only. Occupied unit can be viewed after signed purchase agreement. No access to property with...
$82,000
$82,000
Available: Right Now
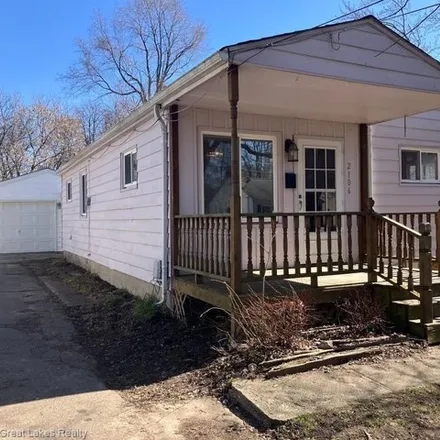
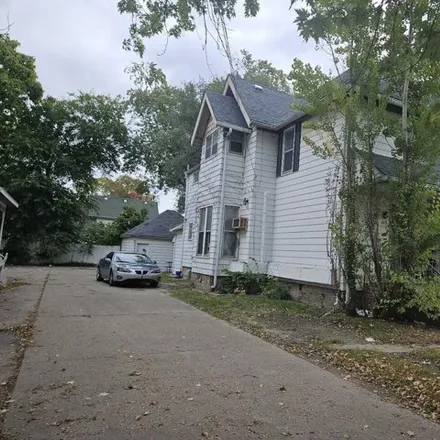
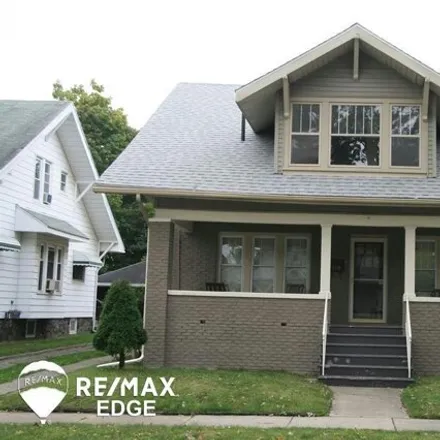
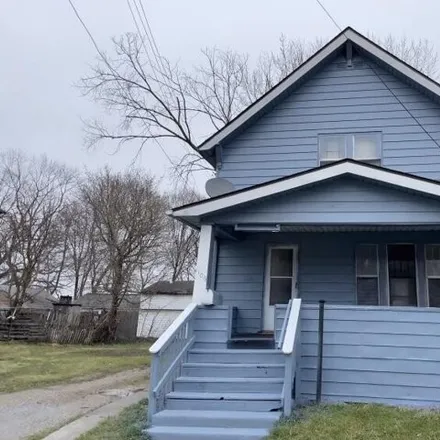
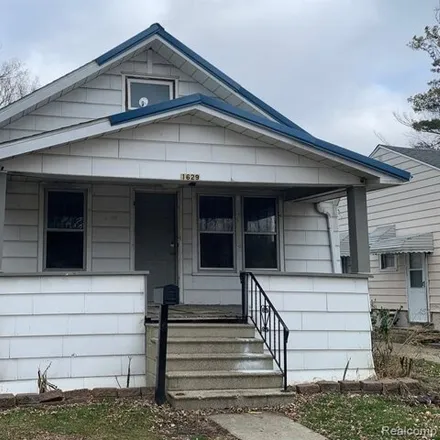
Three-bedroom, two-story home with lots of character. Priced to Sell at$82, 000 AS ISor$99, 900with a brand new roof! The home has been a one-owner home for over 50 years. The heated garage with a wood-burning stove is a mechanic's dream with a hoist...
$129,999
$129,999
Available: Right Now
Welcome to this cozy 3 bedroom, 1 bath home in Burton! With all new flooring, paint, and a refreshed front porch, this house is move in ready. Perfect starter home!! Kitchen has tons of storage and plenty of counter space. Upstairs bedroom features b...
$114,900
$114,900
Available: Right Now
Welcome home to this Beautiful 2 Bed, 1 Bath, Ranch, with a Brand New Shed on a Nice Private Lot. Fully Updated Kitchen and Bathroom with Beautiful White Cabinets, Stainless Steel Appliances, and Coveted Granite. Main floor laundry. Recessed Lights. ...
$154,750
$154,750
Available: Right Now
We lost our buyer ! Attention! Agents of Pre-Approved Buyers: Set your GPS for 2889 Dearborn St. in Flint! When you think you're at the end of the street and you see a sign that says No Outlet just ease on through and the house will be the fir...
$89,900
$89,900
Available: Right Now
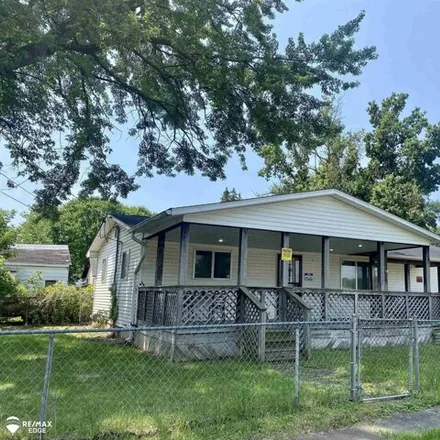
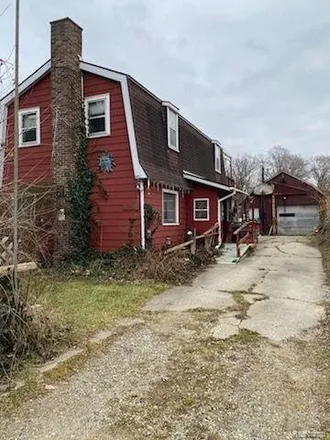
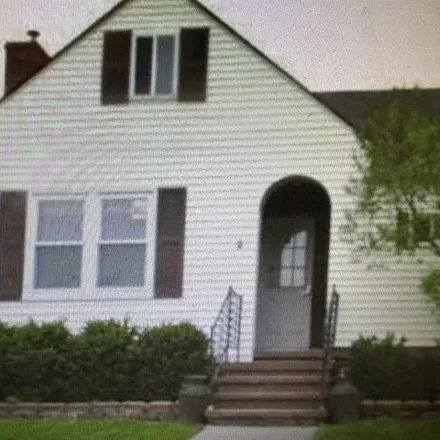
TO all you handymen and women , this house is for YOU! Don't miss out on the opportunity to own this beautiful old home. You could leave it as a 4 bedroom home or convert it back into a duplex. It's definitely a must-see to appreciate all it h...
$67,500
$67,500
Available: Right Now
3-bdrm home in demand area. This home has a reverse Osmosis water treatment system, Wood Pellet Fireplace, and much more. home just minutes from McLaren Hospital in Glendale Hills. Many extras like A large room upstairs would serve as a fourth bedroo...
$73,000
$73,000
Available: Right Now
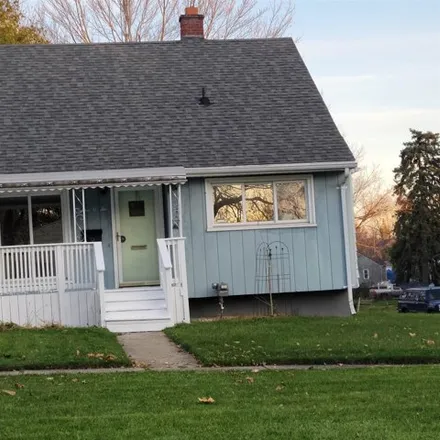
Charming 3-bedroom, 1-bathroom home with a lavatory, featuring beautiful hardwood floors, plush carpeted bedrooms, and fresh paint throughout. The garage boasts a new roof, and some plumbing updates have been done. This cozy one-and-a-half-story prop...
$59,900
$59,900
Available: Right Now
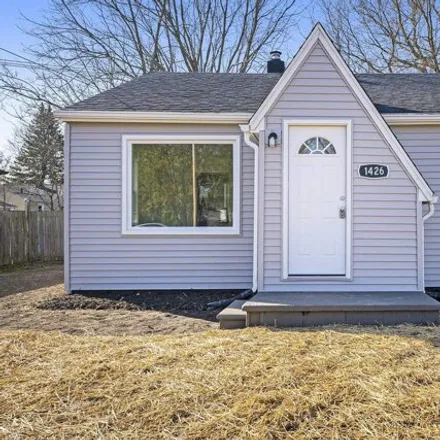
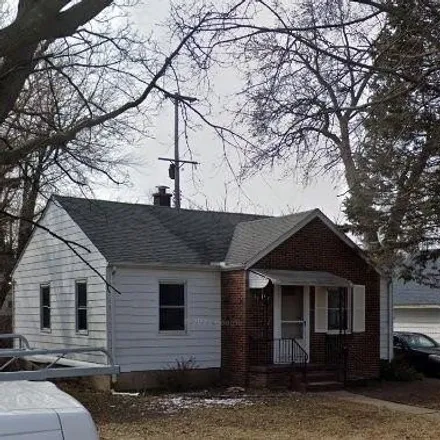
Remodeled and beautifully updated 2 bedroom Ranch Priced to sell at$59, 900.This home has a brand-new Kitchen and bathroom. New hot water heater. New flooring and paint throughout. Attached garage and brand new deck. Home also has a newer roof and si...
$307,895
$307,895
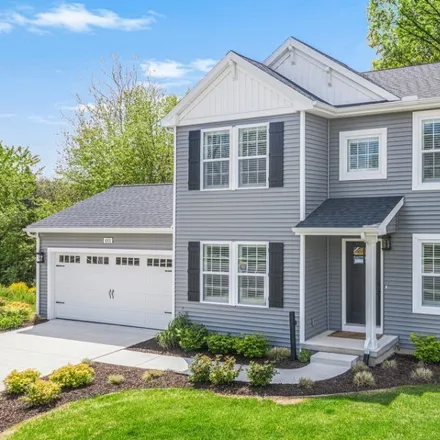
Available: Right Now
$55,000
$55,000
Available: Right Now
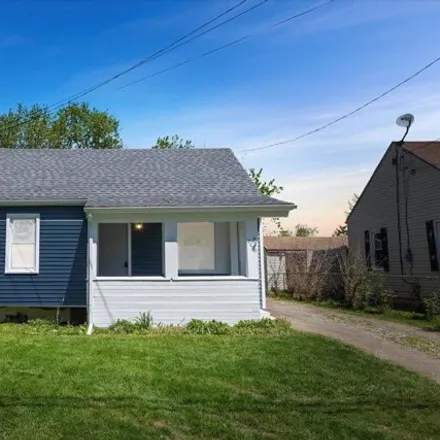
Welcome to your next home or income generating rental property! This home was completely remodeled over the last 3 months including new plumbing 2024, completely repainted exterior and trim 2024, new flooring and carpet 2024, new paint 2024. The home...
$99,000
$99,000
Available: Right Now
Located in the quaint historic College Cultural District, this home features brick and vinyl siding. A two-car insulated garage with electric and generator hookup is a feature of this ranch-style home. There are hardwood flooring, brand-new carpet, n...
$65,000
$65,000
Available: Right Now
Come and check out this cute house that features a lot of potential whether you are a first time home buyer or if you want to add it to your investment portfolio. 3 bedrooms with 1 full bath, finished basement for extra living space, nice backyard fo...
$12,000
$12,000
Available: Right Now
Ready for your next investment project? This house is cleaned out and prepped for you to complete as a fix and flip or fix and rent. Handy people wanting to get a deal on a house with the skills and funds to put this house back together into a home w...
$100,000
$100,000
Available: Right Now
$327,055
$327,055
Available: Right Now
$39,900
$39,900
Available: Right Now
This is the perfect home for a handy homeowner or an investor that doesn't want to do too much work. The rehab was started and is about 80% of the way done. It needs the painting to be completed, bedroom flooring, misc repairs and cleanup. The kitche...

$34,999
$34,999
Available: Right Now
Introducing our charming one-bedroom, one-bath ranch investment property! This home boasts a large fenced backyard, perfect for outdoor activities. The property also includes a convenient shed for extra storage. With its great potential as an investm...
Flint
According to statistics, the population in Flint, MI amounts to 97,810, which shows decline -1% compared to the previous year. The median age of the city’s residents is 35. The average household income is $26,330, shifting growth 3% from the past year, and the average property value in Flint, MI decline -6% to $28,200 throughout the year.
| Population | 97,810 |
| Median Age | 35 |
| Poverty Rate | 41% |
| Household Income | $26,330 |
| Number Of Employees | 30,129 |
| Median Property Value | $28,200 |
What is the Average Price of Apartments for Sale in Flint, MI?
| Month | Median Price |
|---|---|
| Apr 2024 |
$51,834
|
| Mar 2024 |
$51,834
|
| Feb 2024 |
$51,834
|
| Jan 2024 |
$51,834
|
| Dec 2023 |
$51,229
|
| Nov 2023 |
$53,543
|
| Month | Median Price |
|---|---|
| Apr 2024 |
$101,128
|
| Mar 2024 |
$88,200
|
| Feb 2024 |
$88,200
|
| Jan 2024 |
$88,200
|
| Dec 2023 |
$78,840
|
| Nov 2023 |
$105,922
|
Household Income
The average household income in Flint, MI grew from $25,650 to $26,330 in the past year. This data is an estimate based upon 39,780 households in Flint, MI . The chart below presents how household income is distributed in Flint, MI in comparison to the revenue allocation amid households nationally.
Property Value
According to data from last year, the average property value in Flint, MI shifted from $30,000 to $28,200 throughout the year. The subsequent graph indicates the share of properties in the given price range in Flint, MI in comparison to the median property value in the same price segment across the country. According to the data, the greatest share of Flint, MI properties falls in the 'Less Than $10,000' range, which is lower than the most significant median property across the country.
Rent vs. Own
Property Taxes
One of the most important aspects for property owners is the amount of property taxes. This graph shows distribution of property taxes in Flint, MI compared to median property taxes around the country. The prevalent amount of property taxes in Flint, MI equals $1150, which is less than the national average.