Fort Collins, CO, USA apartments for sale
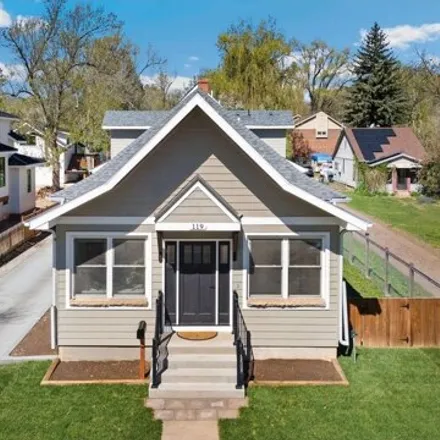
$1,83M
$1,83M
Available: Right Now
Fall in love with the timeless beauty of this 1898 home, now with fully updated interiors and a substantial extension that adds3, 000sqft of living space. Situated on a large lot in the heart of historic Fort Collins, this hidden gem offers the ideal...
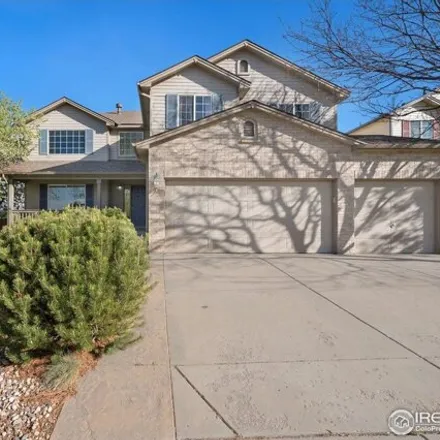
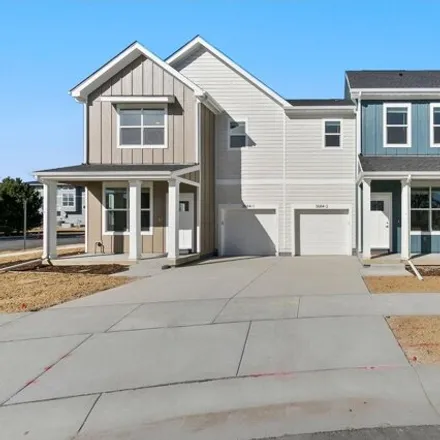
$689,900
$689,900
Available: Right Now
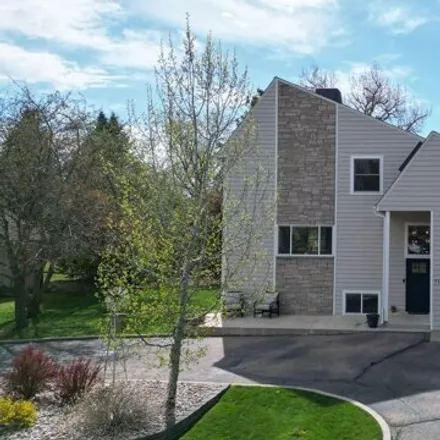
Welcome to 703 Hillrose Ct., a beautifully maintained home with updated finishes throughout. This home is move in ready! Located on a corner lot at the end of a cul-de-sac, with a 3-car garage and large driveway for ample parking space for vehicles o...
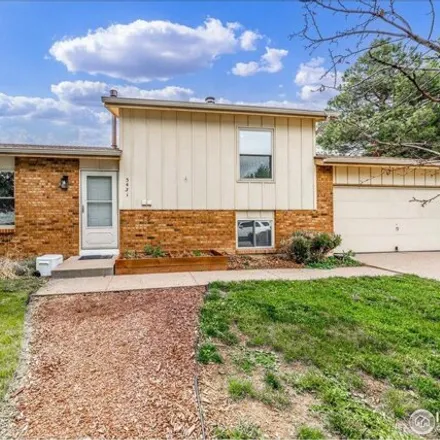
$525,000
$525,000
Available: Right Now
Showings start may 25th ( 2 hour notice required ) Charming tri-level home at 3431 Worwick Dr., Fort Collins. This residence boasts a spacious backyard, ideal for outdoor entertaining and family activities. Inside, enjoy a versatile lay...
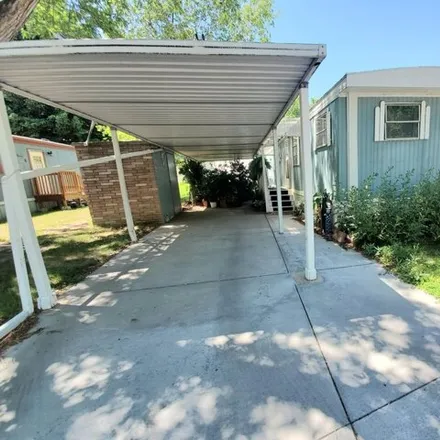
$40,000
$40,000
Available: Right Now
This cute and cozy home may be just the right fit for you! Skyline is a great, upscale community with numerous amenities such as Yard mowing, park, pool, playground, dog park, community garden, RV parking (as available) and community hosted events. H...
$290,000
$290,000
Available: Right Now
Contact agents for showings or with questions. These properties are part of an Affordable homeownership program through Elevation Community Land Trust. Only ECLT-qualified homebuyers whose letters of qualification indicate they are unde...

$519,975
$519,975
Available: Right Now
Excellent floor plan of ranch home in cul-de-sac on large lot in Brown Farm next door to Blevins Middle School. Five bedroom, three bathroom and three common living areas to spread out. Backyard of mature trees has been freshly manicured, brand new c...

$500,000
$500,000
Available: Right Now
This beautiful patio home is the essence of carefree Colorado living. Everything you need is located on the open and airy main floor accentuated by plentiful natural light, vaulted ceilings, and full-height windows at the back of the home leading to ...

$530,000
$530,000
Available: Right Now
Nestled on a sought-after corner lot, this exquisite Ranch-style home welcomes you with an abundance of natural light flooding throughout. Step inside to discover a haven of premium living, featuring engineered veneer hickory hardwood flooring, soari...

$419,900
$419,900
Available: Right Now
Charming Townhome faces a green space on a quiet street in Harvest Park. It is within 2 blocks of Park, Clubhouse, Workout Room, Pool and other Amenities. Newer windows (several yet to be installed), all appliances included, HVAC just 2 years old. Fr...
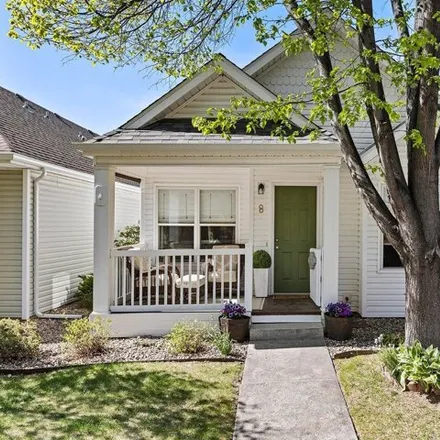
$579,900
$579,900
Available: Right Now
Welcome to your dream cottage in the heart of Miramont! This completely renovated 2-bedroom, 2-bathroom patio home offers the perfect blend of modern comfort and peaceful living. Step into a space where every detail has been meticulously crafted by a...
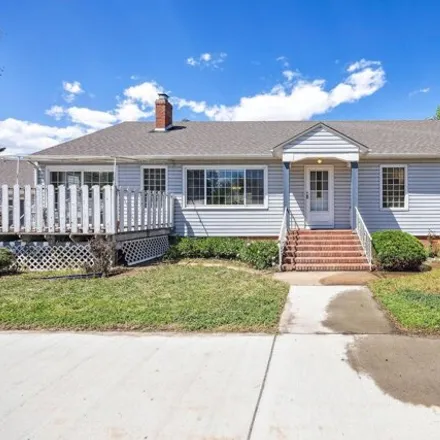
$700,000
$700,000
Available: Right Now
This 1949 Built, sprawling ranch-style home in Historic Old Town is walking distance to CSU, elementary and middle schools - and is a bike ride away, to all that Old Town Fort Collins has to offer! This historic home is full of character, has only ha...
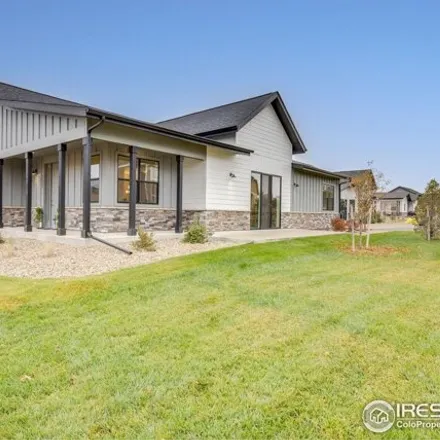
$760,000
$760,000
Available: Right Now
Ready for immediate move in ! Exciting builder incentives await you !This ranch-style residence seamlessly blends contemporary luxury and convenience. Crafted for modern living, it offers low maintenance, allowing you to focus on enjoyi...

$490,000
$490,000
Available: Right Now
Highly desirable condo located in the heart of Old Town Fort Collins! Enjoy living walking distance to shops, restaurants, breweries and more. Enjoy nature and the outdoors by visiting the Poudre River Trail, Lee Martinez park and the new Whitewater ...

$305,000
$305,000
Available: Right Now
This property is part of an Affordable homeownership program through Elevation Community Land Trust (the home is NOT for rent, NOR is it available to investors or cash buyers). AGENTS,please direct your attention to the Brokers remarks ...
$1,09M
$1,09M
Available: Right Now
Finally, the home you have been waiting for is here! Welcome to your beautiful, move-in-ready home in North Fort Collins. Located in Dellwood Heights neighborhood, this amazing saltbox style home sits perfectly to maximize the large lot. Pulling into...
$2,3M
$2,3M
Available: Right Now
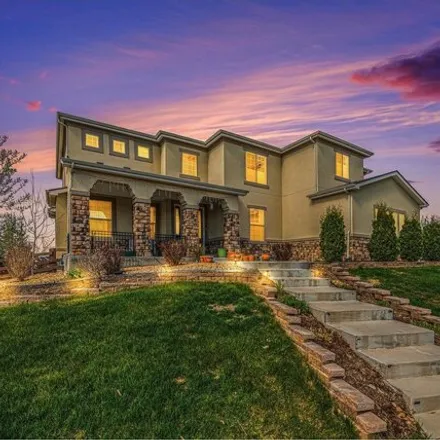
Immaculate!! Meticulous maintained two story in the coveted Estates at Kechter Farm! This home will not disappoint with high end finishes, 20ft ceilings, gourmet kitchen, and open floor plan. Double stair case leads you upstairs to a large primary be...

$369,900
$369,900
Available: Right Now
Welcome home to this beautiful 3 bed, 2 bath end unit condo in desirable midtown Fort Collins. Spacious and bright with open concept kitchen complete with updated cabinets. Large living area with beam ceilings opens out to rear patio with privacy scr...

$275,000
$275,000
Available: Right Now
This well-maintained 2-bedroom, 1-bathroom second level condo offers a perfect blend of comfort and convenience. Featuring brand-new stainless steel appliances and fresh carpet, this condo is move-in ready. Step outside to your quiet covered balcony,...

$550,000
$550,000
Available: Right Now
Nestled in the serene neighborhood of Imperial Estates, known for its spacious lots, this property offers the perfect blend of tranquility and convenience. Located just minutes from Spring Canyon Park, Rocky Mountain High School, and Horsetooth Reser...

$1,95M
$1,95M
Available: Right Now
Here's your chance! Rare opportunity to own this acreage just minutes away from Fort Collins and Horsetooth Reservoir. 35 acres surrounded by open space with views, views, and views. Open floor plan with double staircase, main floor office, and 20ft ...

$429,990
$429,990
Available: Right Now
The Fossil Creek floor plan at Waterfield is an absolute gem! With its thoughtful design and modern amenities, it offers a perfect blend of comfort and style. The layout is ideal for both relaxation and entertaining guests.The first floor, with its s...
$985,000
$985,000
Available: Right Now
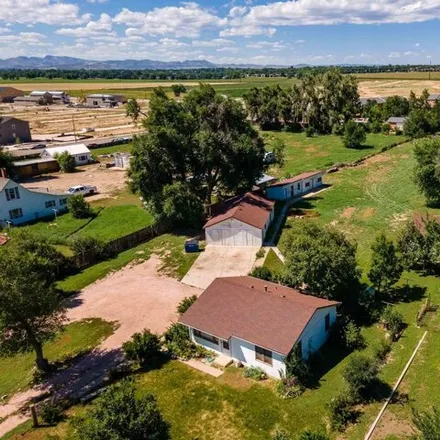
Amazing acreage opportunity, doesn't come around often! 2 acres with lots of potential! House, outbuildings, on 2 acres+/-. Zoning is MMN, development opportunity! Original farmhouse, value is in the land, amazing setting and great views, Sold-As-Is....
Fort Collins
According to statistics, the population in Fort Collins, CO amounts to 159,150, which shows growth 1% compared to the previous year. The median age of the city’s residents is 29. The average household income is $60,110, shifting growth 4% from the past year, and the average property value in Fort Collins, CO growth 8% to $308,800 throughout the year.
| Population | 159,150 |
| Median Age | 29.2 |
| Poverty Rate | 17% |
| Household Income | $60,110 |
| Number Of Employees | 86,913 |
| Median Property Value | $308,800 |
What is the Average Price of Apartments for Sale in Fort Collins, CO?
| Month | Median Price |
|---|---|
| Jun 2024 |
$409,959
|
| May 2024 |
$452,083
|
| Apr 2024 |
$396,000
|
| Mar 2024 |
$396,000
|
| Feb 2024 |
$396,000
|
| Jan 2024 |
$396,000
|
| Month | Median Price |
|---|---|
| Jun 2024 |
$638,090
|
| May 2024 |
$659,022
|
| Apr 2024 |
$683,293
|
| Mar 2024 |
$643,680
|
| Feb 2024 |
$643,680
|
| Jan 2024 |
$643,680
|
Household Income
The average household income in Fort Collins, CO grew from $57,831 to $60,110 in the past year. This data is an estimate based upon 61,532 households in Fort Collins, CO . The chart below presents how household income is distributed in Fort Collins, CO in comparison to the revenue allocation amid households nationally.
Property Value
According to data from last year, the average property value in Fort Collins, CO shifted from $285,400 to $308,800 throughout the year. The subsequent graph indicates the share of properties in the given price range in Fort Collins, CO in comparison to the median property value in the same price segment across the country. According to the data, the greatest share of Fort Collins, CO properties falls in the '$300,000 to $399,999' range, which is higher than the most significant median property across the country.
Rent vs. Own
Property Taxes
One of the most important aspects for property owners is the amount of property taxes. This graph shows distribution of property taxes in Fort Collins, CO compared to median property taxes around the country. The prevalent amount of property taxes in Fort Collins, CO equals $2500, which is less than the national average.