Fort Washington, MD, USA apartments for sale
$1,35M
$1,35M
Available: Right Now
Step into the epitome of luxury living with this magnificent waterfront estate nestled in the prestigious community of Tantallon on the Potomac. Boasting unparalleled water access, this residence is a haven for boat enthusiasts and those who cherish ...
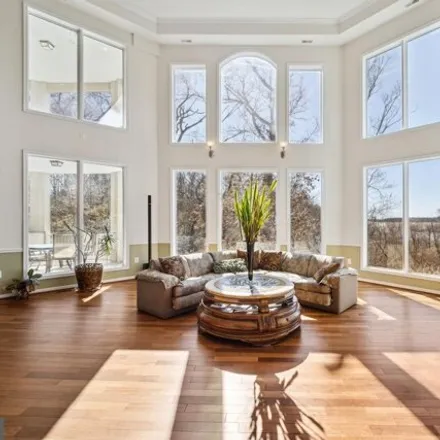
$669,900
$669,900
Available: Right Now
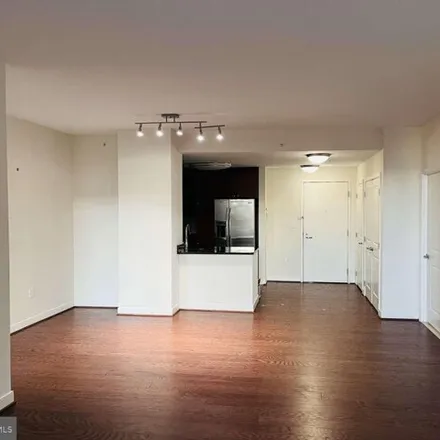
Back on the market, buyer's financing fell through. Upon entering, you are greeted by a contemporary design featuring an expansive living space with ample natural light filtering through large windows. The open-concept layout seamlessly integrates th...
$480,000
$480,000
Available: Right Now
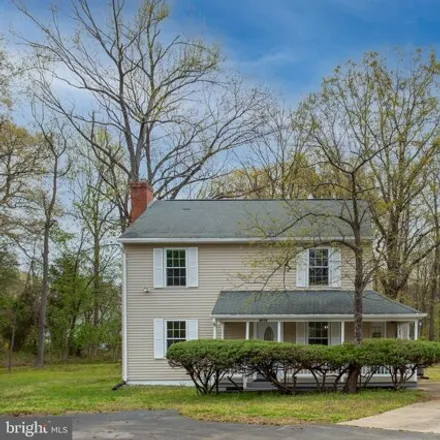
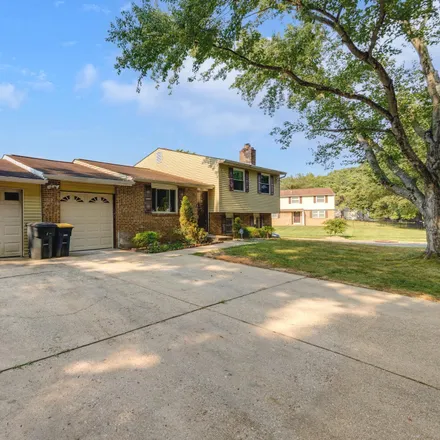
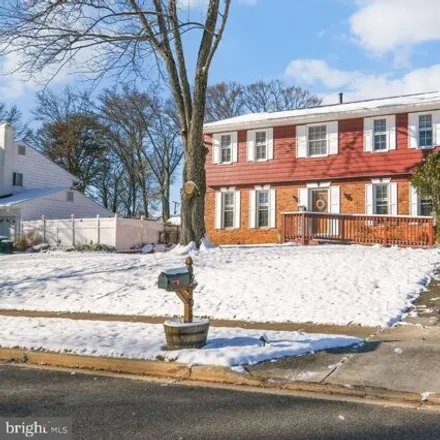
Move right in and enjoy the perfect blend of suburban tranquility and easy access to urban excitement at 8016 Fort Foote Road. This charming 4-bedroom, 2.5-bathroom colonial home underwent a complete renovation in 2020. The 2020 upgrades include a ne...
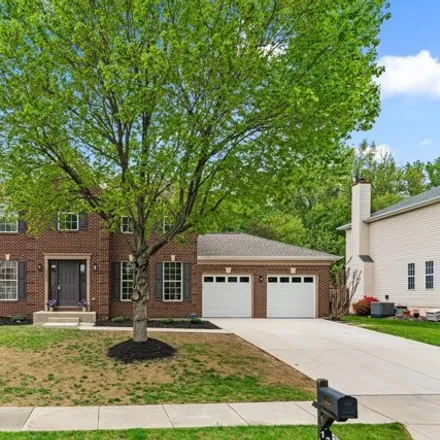
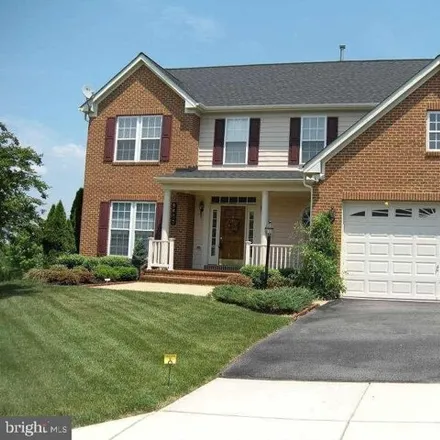
$624,900
$624,900
Available: Right Now
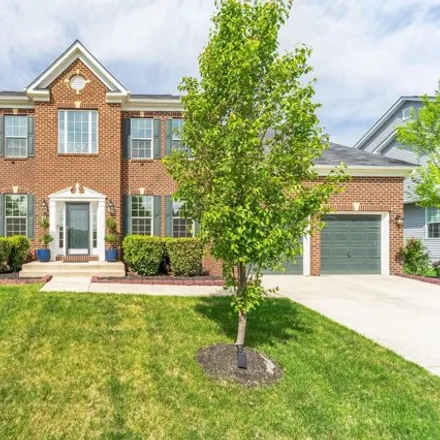
Just renovated. 15 minutes to National Harbor. Move in ready, 4 bedrooms, 2.5 bathrooms colonial. The first floor featuring hardwood floors throughout presents a light filled living room, separate dining room, eat-in kitchen, and family room. The eat...
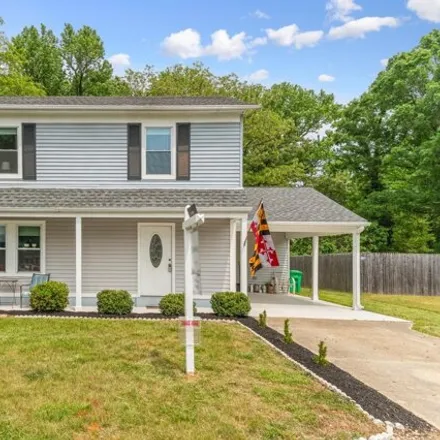
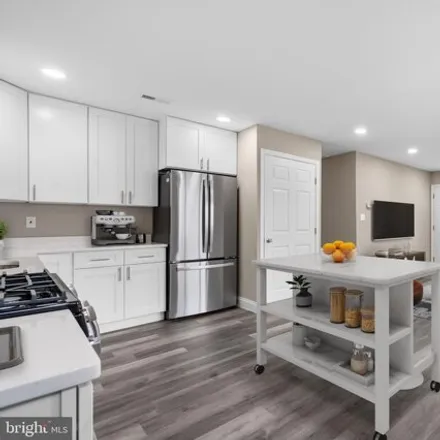
$449,900
$449,900
Available: Right Now
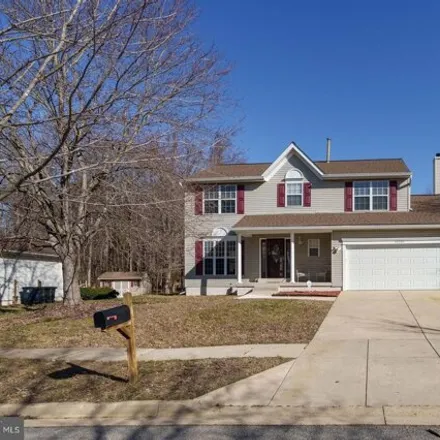
Welcome home to this completely renovated gem just minutes from National Harbor! This charming two-story residence boasts 3 bedrooms and 2 1/2 baths, offering comfort and convenience. Step into the stylish kitchen featuring ceramic tile floors, grani...
$815,000
$815,000
Available: Right Now
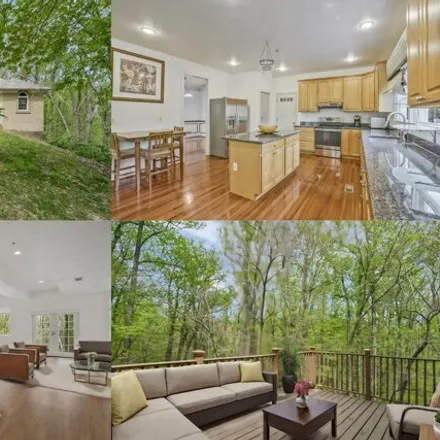
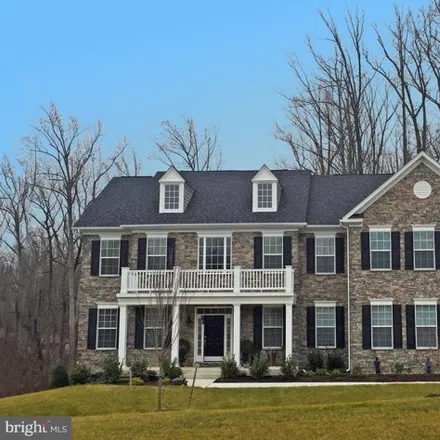
$625,000
$625,000
Available: Right Now
Remarkable Contemporary Residence nestled on a tranquil 1+ acre parcel within a serene neighborhood. This exquisite abode showcases lustrous hardwood flooring, elegant palladian windows, recessed lighting throughout, lofty 10 ceilings, a grand 2-stor...
$425,000
$425,000
Available: Right Now
Welcome to your new home! Step into this beautifully renovated single-family residence offering 5 bedrooms and 2 full bathrooms, featuring modern updates throughout, including a stylishly renovated kitchen with sleek countertops and new appliances. T...
$709,500
$709,500
Available: Right Now
Nestled within the tranquil community of Fort Washington, Maryland, and surrounded by the impressive backdrop of the National Harbor, MGM, and the District of Columbia, this captivating 3 possibly 4th bedroom, 2.5-bathroom residence perfectly marries...
$977,000
$977,000
Available: Right Now
To be built. new construction. Build your dream home super close to the waterfront, MGM, National Harbor and Tanger Outlets!! Tucked away in the heart of an established and upscale community, enjoy the perfect blend of privacy and community li...
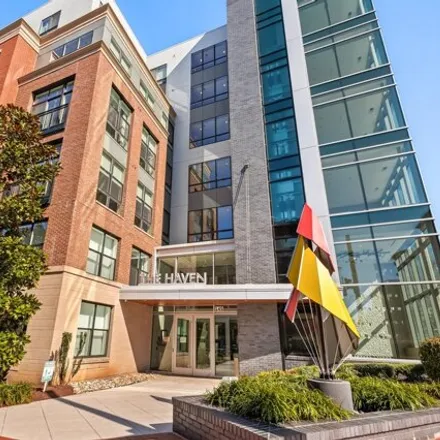
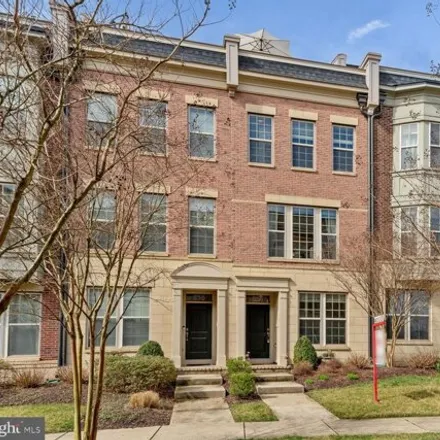
$369,900
$369,900
Available: Right Now
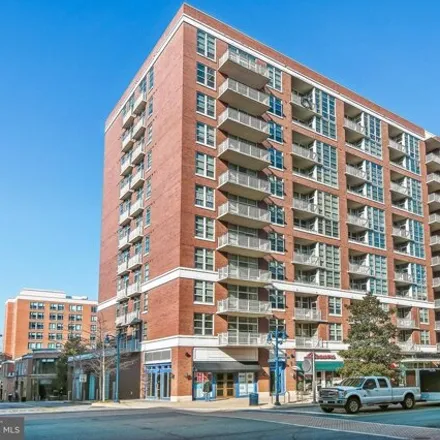
Welcome to the Haven! This bright and spacious 1 bedroom / 1 bathroom has it all! This unit has been kept in immaculate condition since it was built in 2019. Inside you will find a bright and open floor plan with a lovely gourmet kitchen that not onl...
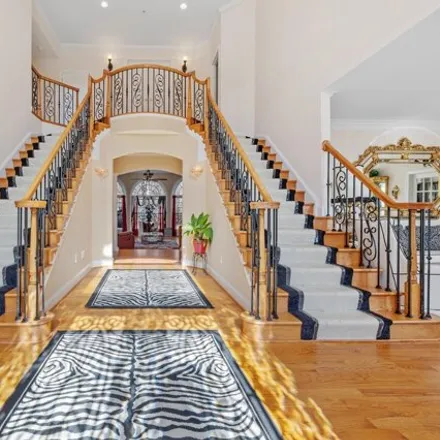
$995,000
$995,000
Available: Right Now
Six Thousand Square Feet ofAMAZING! Indulge in luxury at this Fort Washington residence located in the prestigious Tantallon North subdivision. A true masterpiece, this home boasts opulence at every turn. Step inside and be greeted by the grandeur of...
$349,000
$349,000
Available: Right Now
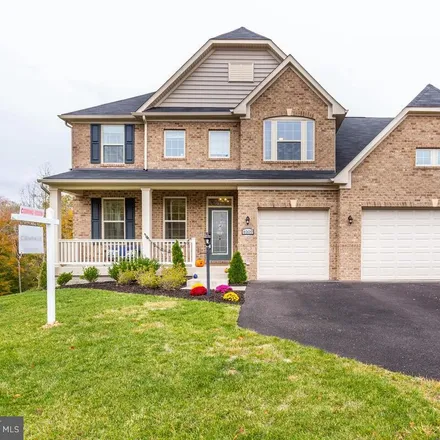
$819,000
$819,000
Available: Right Now
Welcome to immediate luxury living in the coveted Fort Washington Acres Community! The Emory II by Caruso Homes offers over4400 SFof sun-lit, entertaining space. Upon entry, be greeted by a grand two-story foyer adorned with wrought iron balusters, s...
$540,000
$540,000
Available: Right Now
Back on the Market - Buyer's Financing Fell Through Colonial style SFH with 5BRs, 3.5BAs, 2-car garage and fireplace located in the highly sought after Potomac Knolls community. The living room is bright and opens to the dining room which has a bay w...
$375,000
$375,000
Available: Right Now
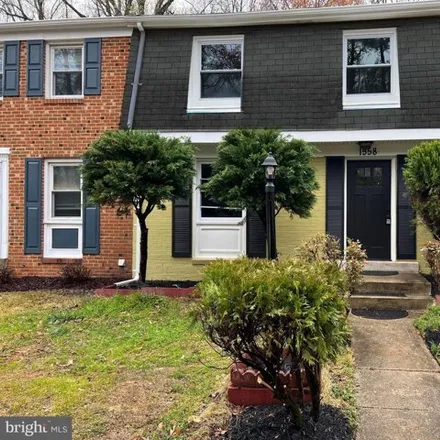
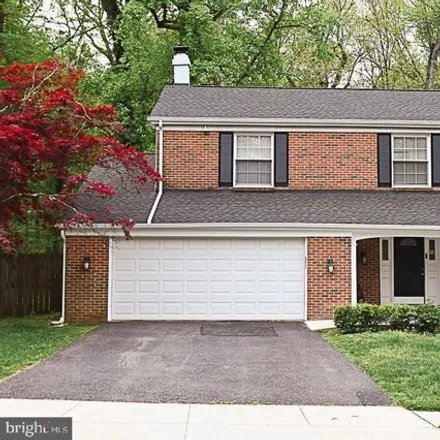
Security system on premisesSerenity now! Welcome to this stunning Townhome with Brick front Elevation, situated on a premium lot backing to absolutely Gorgeous all natural views. Largest Model with 3 levels of luxury finished living space. Designer c...
$475,000
$475,000
Available: Right Now
Back on the market with plenty of updates! Updated Kitchen, flooring, lighting and more. Beautiful, sun lit, South Fort Foote Village four bedroom colonial close to National Harbor, Tanger Outlets, Air Force bases, and the Nation's Capital is move in...
$600,000
$600,000
Available: Right Now
Welcome to your own slice of paradise at 155 Potomac Passage, Unit 502 in the heart of Oxon Hill, MD. Nestled along the picturesque Potomac River, this exquisite condo offers a rare opportunity to experience waterfront living at its finest. Retreat t...
$650,000
$650,000
Available: Right Now
Property is Being Sold As IS : Welcome home to this meticulously maintained 5-bedroom, 4.5 bathroom sanctuary. Its polished hardwood floors enhances the spacious layout that leads to a bright common area with its own wood burning fireplace that can b...
$355,000
$355,000
Available: Right Now
Welcome home to the largest one bedroom model in the building! This luxurious, sun drenched unit offers open concept living at its best! Gourmet kitchen offers sleek black galaxy granite counters, SS appliance package, upgraded lighting and center is...
$350,000
$350,000
Available: Right Now
Come see a great Investor Opportunity or the chance to put the final remodeling touches on your own home. Sitting on one full acre in a stellar location just off of 210, this home features an excellent palette for a spacious home with plenty of lot s...

$1,4M
$1,4M
Available: Right Now
Open House today, Saturday, 4/27,from 1 to 3pm. Come be king/queen of the Hill and master of the Harbor in this large, like-new construction, detached home that affords wonderful, million-dollar views of both the Potomac River waterfront and the DC +...
Fort Washington
According to statistics, the population in Fort Washington, MD amounts to 24,144, which shows growth 1% compared to the previous year. The median age of the city’s residents is 48. The average household income is $105,726, shifting growth 2% from the past year, and the average property value in Fort Washington, MD growth 6% to $324,300 throughout the year.
| Population | 24,144 |
| Median Age | 47.7 |
| Poverty Rate | 7% |
| Household Income | $105,726 |
| Number Of Employees | 12,451 |
| Median Property Value | $324,300 |
What is the Average Price of Apartments for Sale in Fort Washington, MD?
| Month | Median Price |
|---|---|
| Apr 2024 |
$523,687
|
| Mar 2024 |
$523,687
|
| Feb 2024 |
$523,687
|
| Jan 2024 |
$523,687
|
| Dec 2023 |
$488,927
|
| Nov 2023 |
$502,058
|
| Month | Median Price |
|---|---|
| Apr 2024 |
$493,601
|
| Mar 2024 |
$493,601
|
| Feb 2024 |
$493,601
|
| Jan 2024 |
$493,601
|
| Dec 2023 |
$460,870
|
| Nov 2023 |
$421,377
|
Household Income
The average household income in Fort Washington, MD grew from $104,114 to $105,726 in the past year. This data is an estimate based upon 8,263 households in Fort Washington, MD . The chart below presents how household income is distributed in Fort Washington, MD in comparison to the revenue allocation amid households nationally.
Property Value
According to data from last year, the average property value in Fort Washington, MD shifted from $305,800 to $324,300 throughout the year. The subsequent graph indicates the share of properties in the given price range in Fort Washington, MD in comparison to the median property value in the same price segment across the country. According to the data, the greatest share of Fort Washington, MD properties falls in the '$300,000 to $399,999' range, which is higher than the most significant median property across the country.
Rent vs. Own
Property Taxes
One of the most important aspects for property owners is the amount of property taxes. This graph shows distribution of property taxes in Fort Washington, MD compared to median property taxes around the country. The prevalent amount of property taxes in Fort Washington, MD equals $3000, which is less than the national average.