Harlingen, TX, USA apartments for sale
$280,000
$280,000
Available: Right Now
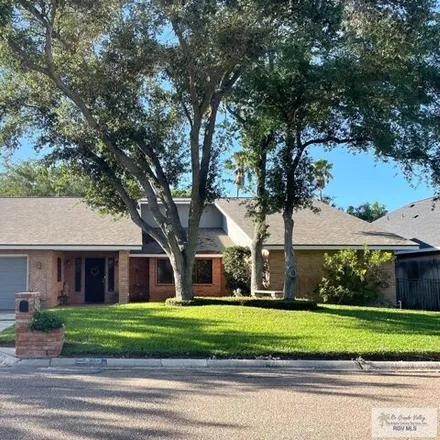
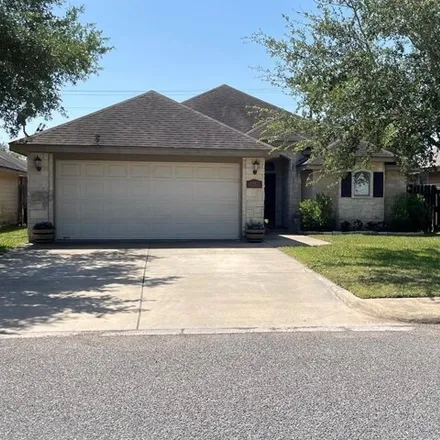
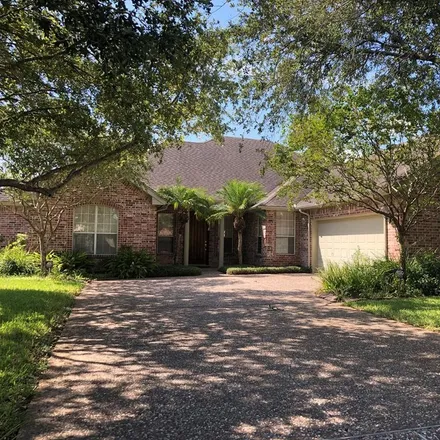
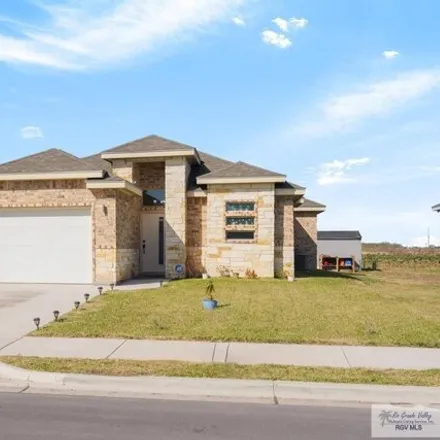
This Beautiful home is located In very desirable neighborhood/area with convenient access to mayor roads, shopping, and schools. It features a country like style open concept and a large center island open to the living and dining areas. This home al...
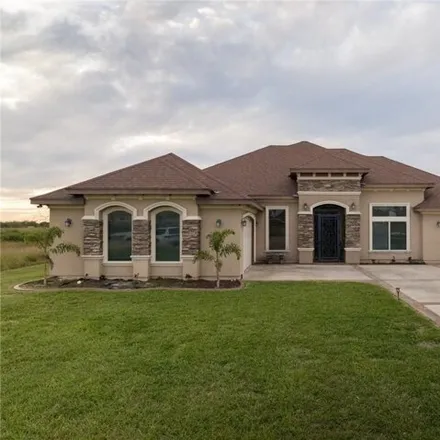
$319,900
$319,900
Available: Right Now
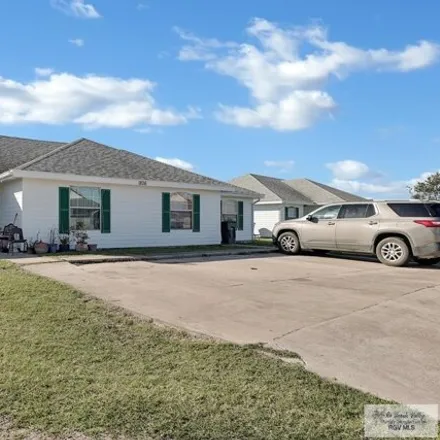
Wonderful spacious 4 bedroom 3 bath home on corner lot in Parkwood. House has a two car garage - oversized. This great home has a large family room and a beautiful gourmet kitchen. Kitchen is large with lots of storage and counter space. House sits o...
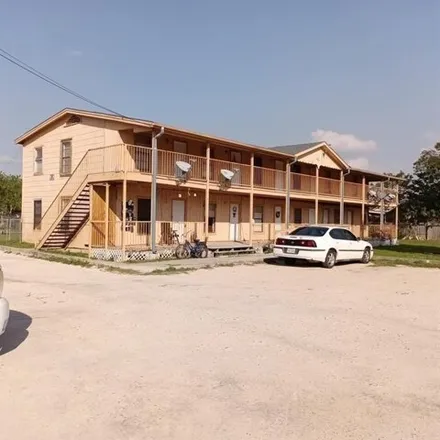
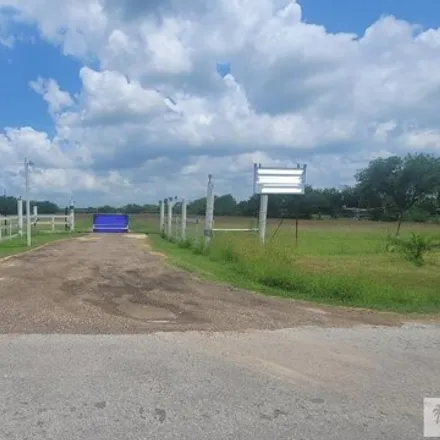
$450,000
$450,000
Available: Right Now
Unlock the potential of this remarkable multi-family gem! Nestled within an expansive oversized lot, this property boasts boundless opportunities for generating stellar income. Discover twelve cozy 1-bedroom, 1-bath units alongside a charming 2-bedro...
$544,900
$544,900
Available: Right Now
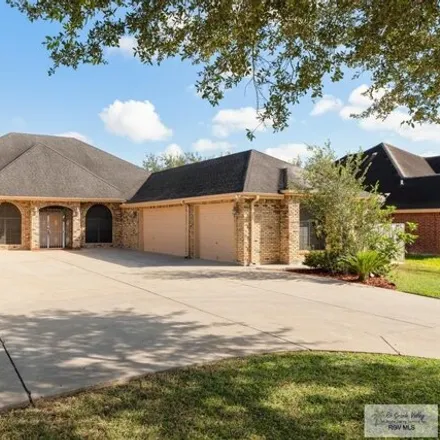
Welcome to 14573 McKenzie Ln. This Custom home features 4 bedrooms, 3.1 bathrooms, an office, a game room, an in ground pool, a fire pit, a large back patio, and storage building all sitting on just under half an acre. As you enter the large wooden d...
$409,900
$409,900
Available: Right Now
Located in the desirable Treasure Hills neighborhood, this lovely, well maintained home offers an expansive3, 672sq. ft. of living space. The house features 4 bedrooms, 2.5 baths, two substantial living areas that provide ample room for relaxation an...
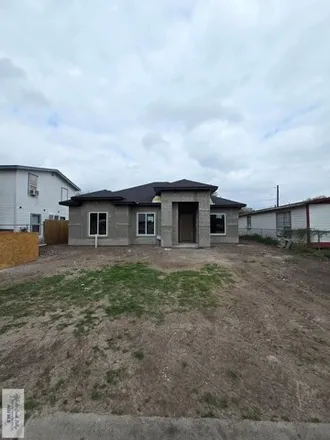
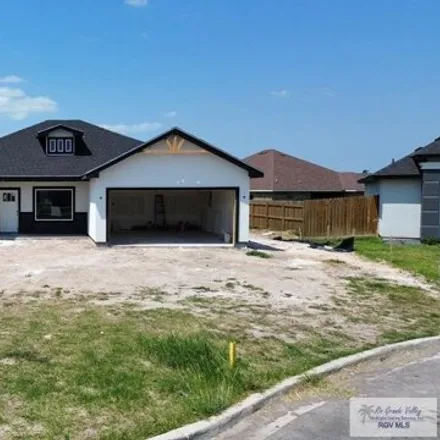
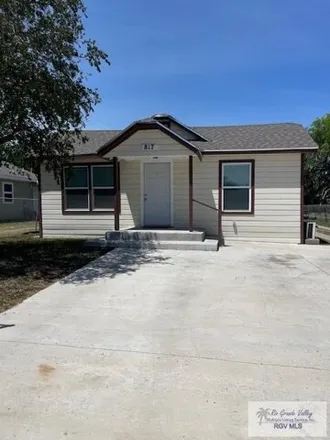
$192,000
$192,000
Available: Right Now
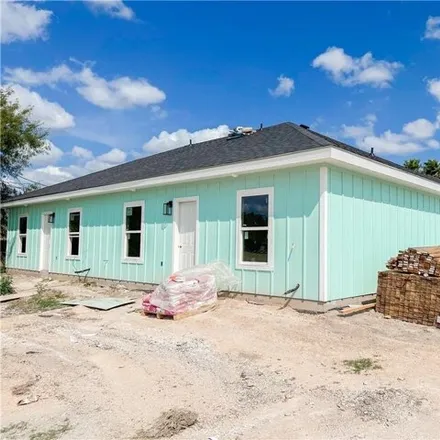
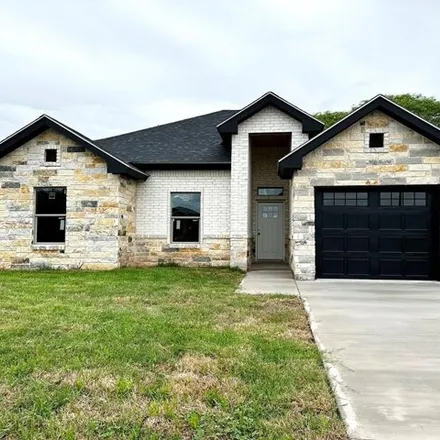
New Construction home with 3 bedrooms/2 bath near Zavala Elementary. This home features an open concept floorplan with modern finishes. Recess lighting throughout the home, ceiling fans in all the rooms, ceramic tile, and quartz counter tops with a n...
$510,000
$510,000
Available: Right Now
Hidden gem ! This unique estate features a mid-century built home that has maintained much of it's original charm and structure. This spacious 4 bedroom/3 bath home welcomes you with a covered front porch. Home is accented with original hardwood floo...
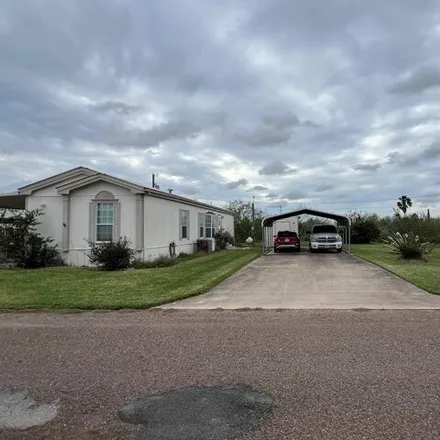
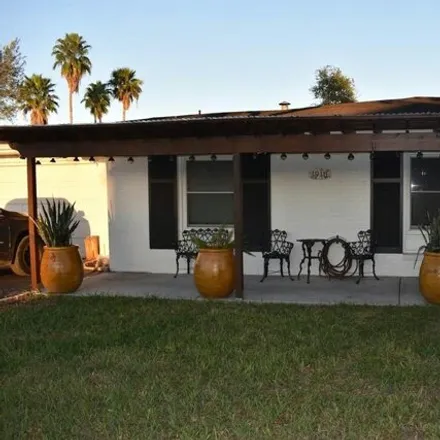
$124,500
$124,500
Available: Right Now
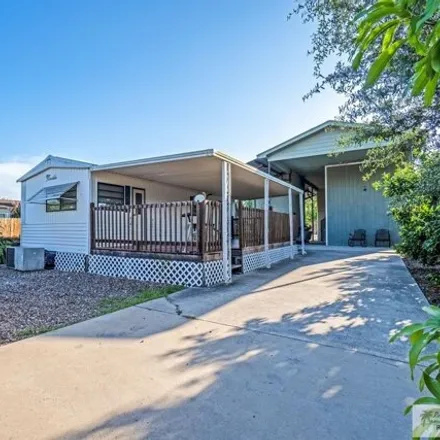
A very well maintained property with 2 bedrooms and 2 baths. All appliances pass with sale. A very spacious living area a large kitchen. Master suite is very spacious bathroom with a garden tub. Electric fireplace also passes with sale. A very large ...
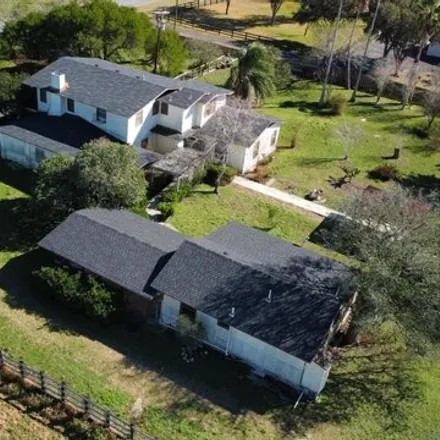
$875,000
$875,000
Available: Right Now
The property is gated with an electronic entry gate. The home is a two-story, with approximately1, 476sq. ft. in living area. There is also a detached improvement with two rental units, an efficiency apartment, and an office area. Detached from the h...
$277,000
$277,000
Available: Right Now
This Multi-Family property has been recently remodeled. The front/main house features a spacious living area and dining area. The kitchen has been tastefully updated with new cabinetry, recessed lighting and countertops as well. There are two bedroom...
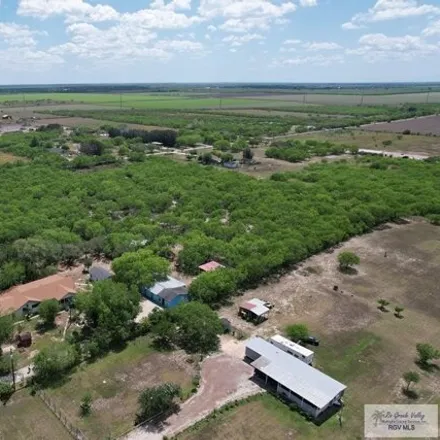
$549,000
$549,000
Available: Right Now
Nestled in the serene surroundings of San Benito, TX, this property boasts 10 acres of land and a spacious house spanning over3, 500square feet. Although the house requires some tender loving care (TLC), its size offers ample potential for renovation...
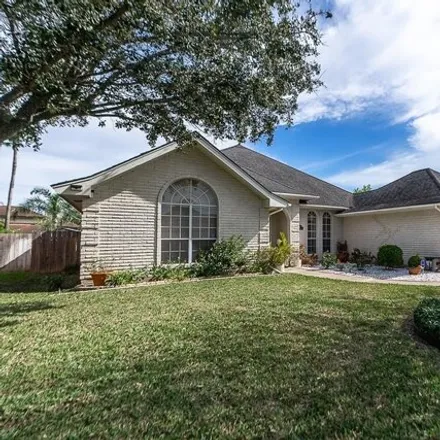
$350,000
$350,000
Available: Right Now
Gorgeous home built by Leggett Custom Builders and owned by original owners. This well constructed and engineered home has 4 bedrooms and 3 bathrooms. Closets are plentiful. Home has a beautiful gourmet kitchen and has two open living areas. It is ve...
$1,4M
$1,4M
Available: Right Now
Fantastic Investment Opportunity, this brand NEW Caribbean style 10 Unit Multi-family property is in the perfect location just walking distance from Harlingen School of Health Professions and Memorial Middle School, close to the 499 Loop and minutes ...
$270,000
$270,000
Available: Right Now
Turn key house. Well taken care of and ready for a new family to call it home. 4 bedrooms( each bedroom has a walk in closet) and a bonus room that can be used as an office or playroom. Beautiful backyard. Perfect for entertaining your family and fri...
$499,900
$499,900
Available: Right Now
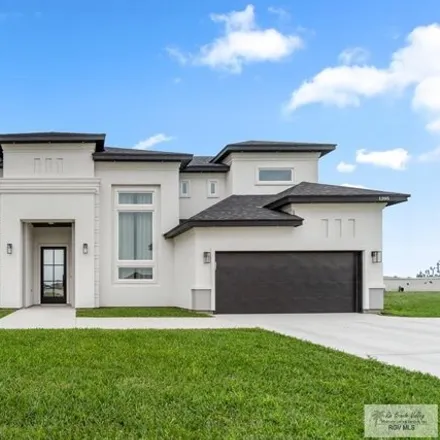
Introducing a stunning two-story gem in Harlingen, featuring four bedrooms, three full baths, and one half bath spread across a spacious2, 560square feet. Located near Garret Road, this home offers the perfect blend of convenience and luxury, with Ta...
$75,500
$75,500
Available: Right Now
$340,000
$340,000
Available: Right Now
$230,000
$230,000
Available: Right Now
Great Investment Opportunity! Nice duplex featuring 2 large bedrooms and 2 baths. Both units include a stove, refrigerator, washer and dryer. Recently painted outside, some units have tile and other types of flooring...both units vary in features. Te...
$550,000
$550,000
Available: Right Now
4 Bedrooms, 3 bathrooms, 3 car garage; master has large walk-in closet, double vanity sink; 2nd bedroom with walk-in closet; open concept living room/dining room; second dining room/foyer; study/office/fifth bedroom; extremely large family room with ...
$225,000
$225,000
Available: Right Now
This brand new build is a 3-bedroom, 2-bathroom gem that comes complete with a convenient 1-car garage. This home offers a perfect blend of comfort, style, and accessibility. It is ideally located approximately 5 minutes away from Expressway 77, maki...
$219,900
$219,900
Available: Right Now
Gorgeous 3/2/1 Home located in a desirable subdivision just off of Wilson Rd. This home is Move-in ready and features an open split floor plan, Fabulous Kitchen with anISLAND,quartz countertops, walk-in pantry, and custom cabinetry. You will L...
$160,000
$160,000
Available: Right Now
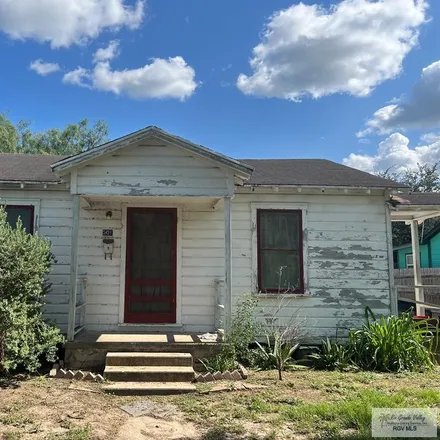
Great investment opportunity ! This cozy home is well maintained, located on a fenced property, lies within close proximity to the expressway, and it offers plenty of space for entertainment. You'll find plentiful shade, an outdoor chimney, a ...
Harlingen
According to statistics, the population in Harlingen, TX amounts to 65,444, which shows decline 0% compared to the previous year. The median age of the city’s residents is 31. The average household income is $38,122, shifting growth 7% from the past year, and the average property value in Harlingen, TX growth 5% to $85,700 throughout the year.
| Population | 65,444 |
| Median Age | 31.1 |
| Poverty Rate | 30% |
| Household Income | $38,122 |
| Number Of Employees | 23,895 |
| Median Property Value | $85,700 |
Household Income
The average household income in Harlingen, TX grew from $35,718 to $38,122 in the past year. This data is an estimate based upon 20,654 households in Harlingen, TX . The chart below presents how household income is distributed in Harlingen, TX in comparison to the revenue allocation amid households nationally.
Property Value
According to data from last year, the average property value in Harlingen, TX shifted from $81,900 to $85,700 throughout the year. The subsequent graph indicates the share of properties in the given price range in Harlingen, TX in comparison to the median property value in the same price segment across the country. According to the data, the greatest share of Harlingen, TX properties falls in the '$80,000 to $89,999' range, which is lower than the most significant median property across the country.
Rent vs. Own
Property Taxes
One of the most important aspects for property owners is the amount of property taxes. This graph shows distribution of property taxes in Harlingen, TX compared to median property taxes around the country. The prevalent amount of property taxes in Harlingen, TX equals $800, which is less than the national average.