Huntertown, IN, USA apartments for sale

$393,000
$393,000
Available: Right Now
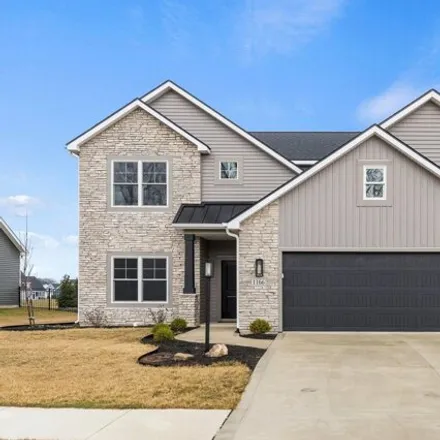
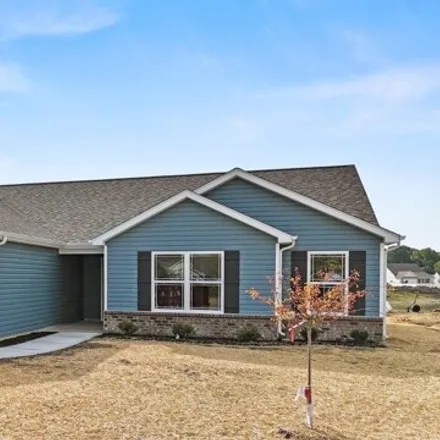
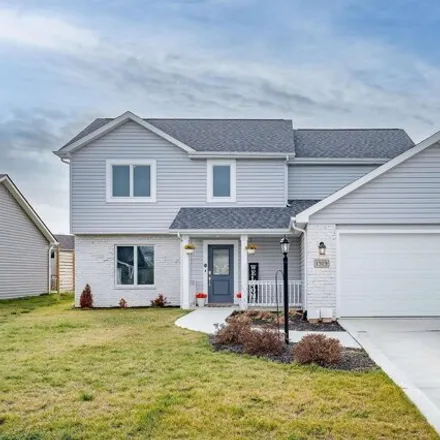
Introducing a stunning new construction home that blends classic design with modern amenities, this two-story residence features a stylish exterior adorned with a combination of durable vinyl siding and elegant stone accents. The welcoming facade is ...
$434,900
$434,900
Available: Right Now
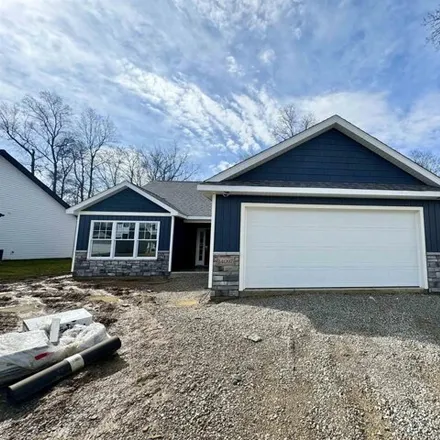
Open house Sunday 3/17 from 1-3PM Welcome to your dream home, recently built by MBN Properties! This modern gem, nestled in the heart of Northwest Allen County, boasts2, 100sqft of stylish living space, complete with a 3-car attached garage. W...
$349,900
$349,900
Available: Right Now
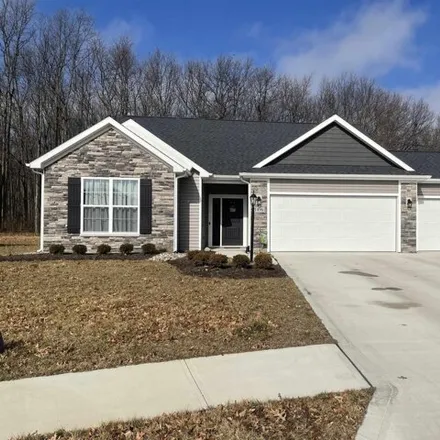
Better than new, 2 year old Northwest ranch with private cul-de-sac lot backing to woods. Open floor plan with 3 bedrooms, 2 full baths. The spacious foyer leads to the great room with 10' tray ceiling which is open to the kitchen. Kitchen has island...

$499,000
$499,000
Available: Right Now
If comfort counts, this delightfully pleasant, well appointed, 5 bedroom , 4 bath, 4216sq. ft. home is the one for you. Located on one of the largest lots on a quiet cul-de-sac surrounded by new homes. 2 bedrooms are master suites. Full bath on main ...

$339,900
$339,900
Available: Right Now
Beautiful Blackthorne from Kiracofe Homes available. This split bedroom 3 bed 2 bath home offers his and hers master walk-in closets, a water closet in the master bath, a walk in shower, double vanity sinks, a ceiling fan in the master bedroom, and s...

$415,900
$415,900
Available: Right Now
Fantastic opportunity in this rare home with a Basement in the coveted NWA School District! This like-new construction boasts an open floor plan and thoughtful design. Entertain effortlessly in the kitchen featuring stainless steel appliances, quartz...
$257,695
$257,695
Available: Right Now
Visit a Model to schedule an Appointment! Model homes are OPEN Mon-Wed 1pm - 6pm, Sat-Sun 12-5pm. Floorplan available to build! Lancia's latest update with the Wingate Elevation A with alternate Modern ElevationB. 1203sq.ft. 3BDR,2Bath. Open floorpla...
$418,900
$418,900
Available: Right Now
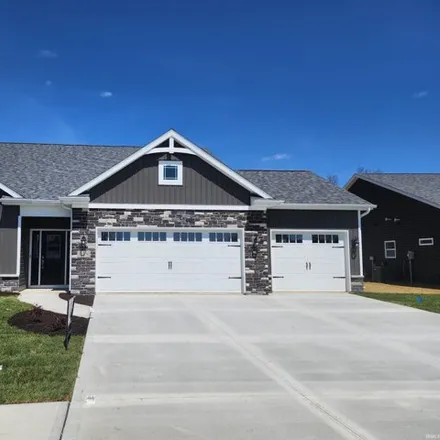
Nestled on a beautiful pond lot is the Merlot by Majestic Homes. This very popular Cottage Series home is located in The Cottages at Copper Creek. The Merlot offers a beautiful stone front elevation, 3 bedrooms, 2 full baths, a large master suite wit...

$439,900
$439,900
Available: Right Now
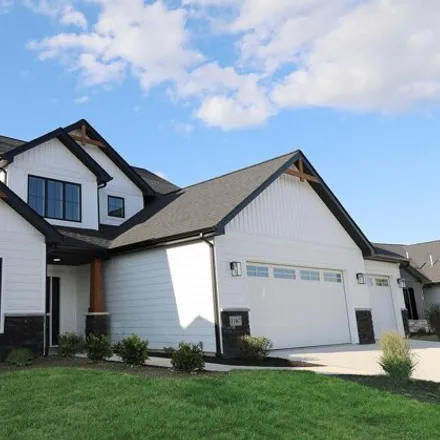
Carriage Place Homes presents a functional 4 bedroom 2.5 bath 2 story. Inside you will appreciate the attention to detail and great use of space. The Kitchen has ample custom stained maple cabinets, a large breakfast bar, quartz counter-tops, glass t...
$319,900
$319,900
Available: Right Now
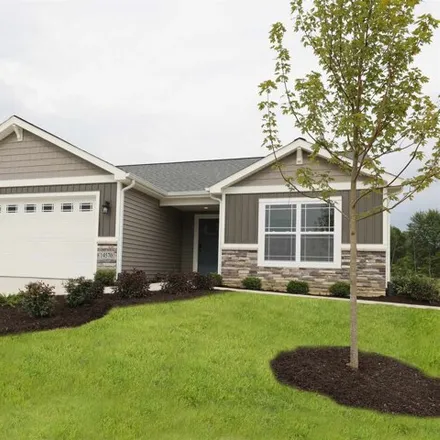
Open House Friday - Saturday1/19-1/20 1-3 PMWelcome to this beautiful new custom home tucked away in Majestic Pointe! Built by Majestic Homes this ranch style home offers3BR/2BAan attached garage, and over 1600 sq ft of living space to make your own!...

$344,900
$344,900
Available: Right Now
Completed ! Qualifies for $0 down USDA loan! Tired of settling for someone else's dream home? This beautiful ranch home sits on a great lot that overlooks a wooded section in the new Grand Pointe at Copper Strike Pass subdivision. Enjoy the tr...
$379,900
$379,900
Available: Right Now
Carriage Place Homes by Jeff Godfrey features one of their most popular floor plans - The Shay. Situated on a tree-lined lot, this split bedroom home accommodates a spacious Great Room with a corner stone fireplace. The Kitchen has ample custom maple...

$417,900
$417,900
Available: Right Now
Welcome to The Cottages at Copper Creek. The Cottage Series by Majestic Homes offers 10 floor plans, 5 Exterior color packages, and many wonderful standards that can only be found in the Cottage Series. This home is situated on a beautiful pond lot a...
$427,763
$427,763
Available: Right Now
Floorplan available to build! Lancia's latest Ashley III plan has2, 543sq.ft, 4 Bedrooms including Owner Suite on the Main, 2.5 Baths, 3-Car Garage, Bonus Loft area and Office. Open floorplan with cathedral ceiling. This eye-catching home has style i...

$289,900
$289,900
Available: Right Now
Welcome to your dream home! This stunning five year old residence offers modern living with an open concept design and an abundance of natural light throughout. The kitchen is a chef's delight, featuring upgraded quartz countertops, upgraded cabinets...

$318,000
$318,000
Available: Right Now
Start Showing Date: 7/1/2024Listing coming soon. Showings start July 1st. Open house Monday July 1st 5-7 Stunning Home in Huntertown! Welcome to this meticulously maintained 3-bedroom, 2 full baths, and 2 half baths residence that epitomizes comfort ...
$424,900
$424,900
Available: Right Now
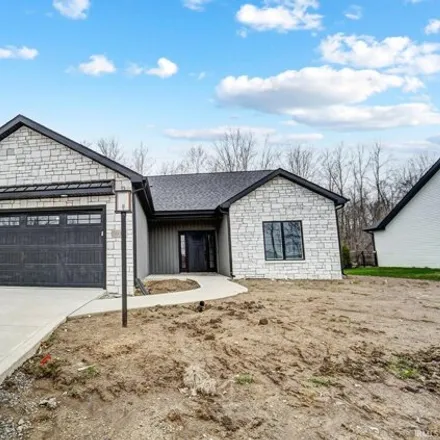
Carriage Place Homes presents an open, split bedroom ranch located in NWAC School District. This home accommodates a spacious Great Room with a stone fireplace flanked by bookshelves. The Kitchen has ample custom cabinets, a large island, nice walk-i...
$349,900
$349,900
Available: Right Now
Need more space for the holidays? This better-than-new, move-in ready, hard to find four bedroom 2-story home is a must seein NW Allen County school district! Located in Willow Ridge subdivision just off W Cedar Canyons Rd in quiet and peaceful area ...

$455,900
$455,900
Available: Right Now
Built by kam ! When looking at a KAM built home you are looking at a quality built home, with over 2400 square feet you wont want to miss this. Home is situated on a cul-da-sac lot with a private backyard that backs up to woods and a small cre...

$425,000
$425,000
Available: Right Now
Here is your opportunity to live peacefully on 5-acres in NWAC schools. This home has 4 beds and 2 1/2 bathrooms there is plenty of room to spread out with the two living spaces plus a full basement that could be finished to your liking for even more...

$359,900
$359,900
Available: Right Now
Welcome to your new home by Granite Ridge Builders, located at 15561 Brimwillow Drive in the serene Hunter's Reserve community. This Hartwood A floor plan offers1, 328sq ft of well-designed living space, featuring 3 bedrooms and 2 bathrooms. Features...

$307,500
$307,500
Available: Right Now
Start Showing Date : 5/26/2024 open house sunday, may 26 from 1pm-3pm Welcome to your dream home at 1677 Copper Mine Passage! This stunning single story, slab, 3 bed, 2 bath home is located in The Rapids of Copper Creek and includes1, 583squar...
Huntertown
According to statistics, the population in Huntertown, IN amounts to 6,857, which shows growth 30% compared to the previous year. The median age of the city’s residents is 35. The average household income is $74,575, shifting growth 3% from the past year, and the average property value in Huntertown, IN growth 11% to $154,500 throughout the year.
| Population | 6,857 |
| Median Age | 35.3 |
| Poverty Rate | 5% |
| Household Income | $74,575 |
| Number Of Employees | 3,188 |
| Median Property Value | $154,500 |
What is the Average Price of Apartments for Sale in Huntertown, IN?
| Month | Median Price |
|---|---|
| Jun 2024 |
$360,430
|
| May 2024 |
$410,226
|
| Apr 2024 |
$434,828
|
| Mar 2024 |
$434,828
|
| Feb 2024 |
$434,828
|
| Jan 2024 |
$434,828
|
Household Income
The average household income in Huntertown, IN grew from $72,292 to $74,575 in the past year. This data is an estimate based upon 2,337 households in Huntertown, IN . The chart below presents how household income is distributed in Huntertown, IN in comparison to the revenue allocation amid households nationally.
Property Value
According to data from last year, the average property value in Huntertown, IN shifted from $139,200 to $154,500 throughout the year. The subsequent graph indicates the share of properties in the given price range in Huntertown, IN in comparison to the median property value in the same price segment across the country. According to the data, the greatest share of Huntertown, IN properties falls in the '$125,000 to $149,999' range, which is lower than the most significant median property across the country.
Rent vs. Own
Property Taxes
One of the most important aspects for property owners is the amount of property taxes. This graph shows distribution of property taxes in Huntertown, IN compared to median property taxes around the country. The prevalent amount of property taxes in Huntertown, IN equals $1150, which is less than the national average.