Jersey City, NJ, USA apartments for sale
$569,000
$569,000
Available: Right Now
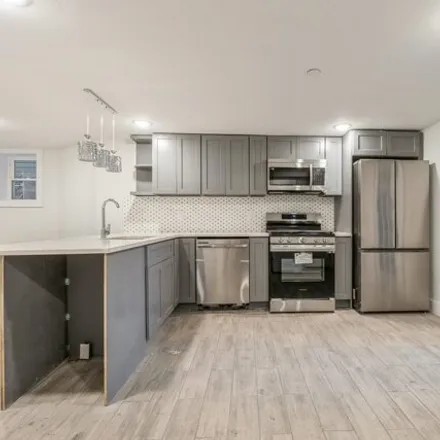
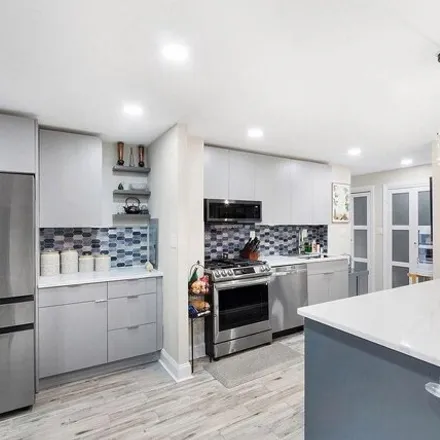
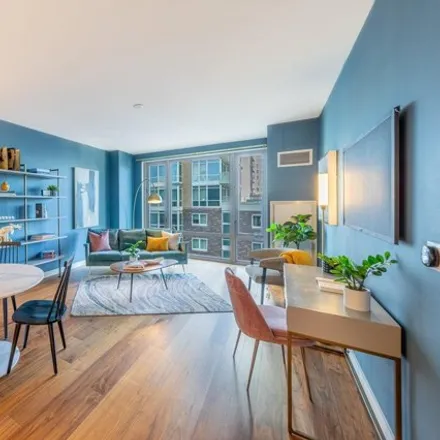
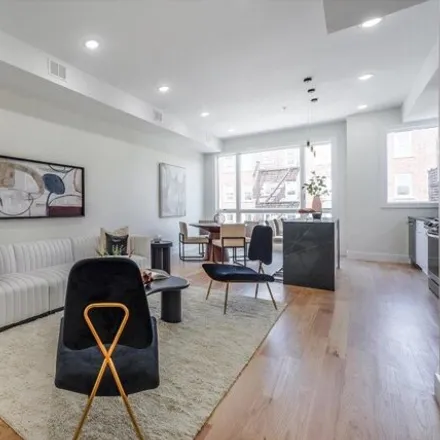
This meticulously designed 1330 square foot basement apartment is the epitome of modern living, offering a perfect blend of style, comfort, and affordability. Step into a sunlit open-concept living space that seamlessly integrates the living, dining,...
$849,999
$849,999
Available: Right Now
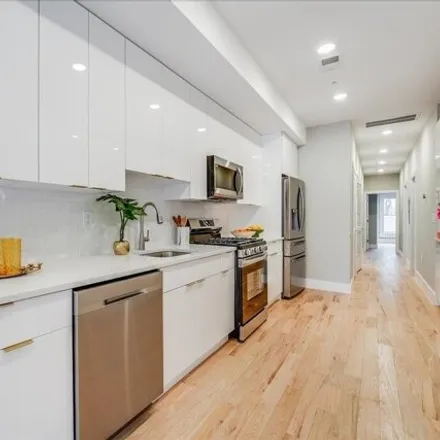
Welcome to this stunning 840 Sq Ft1BR/1BAhome in the highly sought-after Shore Club. Renovated with contemporary flair, this residence boasts a recently renovated kitchen that is sure to impress. Revel in the modern upgrades including a new floor, re...
$1,6M
$1,6M
Available: Right Now
Your chance to own an incredible, one-of-a-kind 3-family home in the prime Hamilton Park area of downtown Jersey City! 10 minutes to Grove Path Station for an effortless commute or fun in the city. Enjoy a beautiful day in Hamilton Park, just one blo...
$510,000
$510,000
Available: Right Now
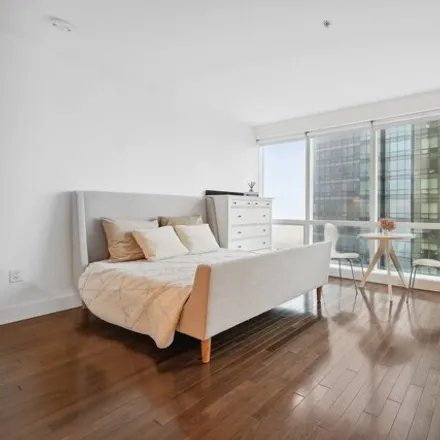
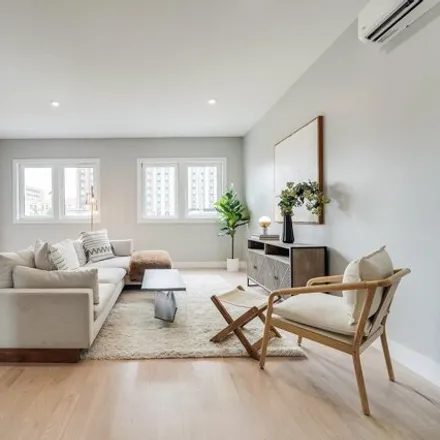
Welcome to your luxurious urban retreat where comfort and style harmonize perfectly! This expansive 968 sq ft penthouse level 1 BR condo boasts stunning sunset views that will captivate you. Recently renovated with a modern flair and sleek high-end f...
$889,000
$889,000
Available: Right Now
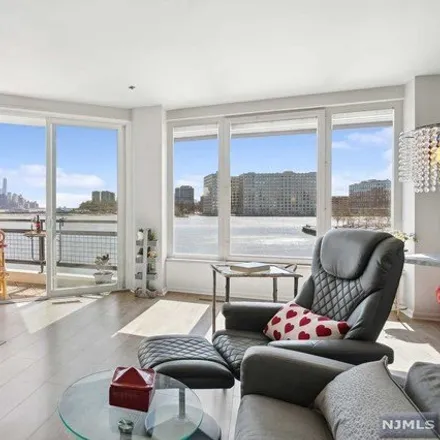
Experience waterfront living at its finest in Jersey Citys newest luxury condominium development, Park and Shore. This exquisite top-floor residence boasts a rare 1 bed/1 bath layout with east-facing exposure, flooding the space with natural light an...
$379,000
$379,000
Available: Right Now
Delight in this beautifully maintained 750 square foot condo in prestigious Port Liberte with partial NYC Skyline and Hudson River views! This home is the perfect synthesis of relaxation and comfort with stunning hardwood flooring throughout, recesse...
$350,000
$350,000
Available: Right Now
Polished 1 bedroom, 1 bath with stunning park views and a peek of uptown NYC view from your private balcony. This modern, newly updated residence offers NEW insulated noise reduction windows, wide plank floors, distinct lighting fixtures, private bal...
$749,000
$749,000
Available: Right Now
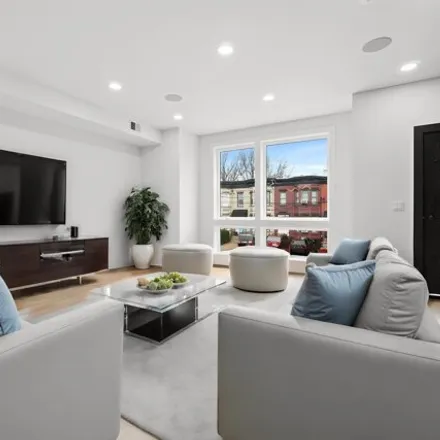
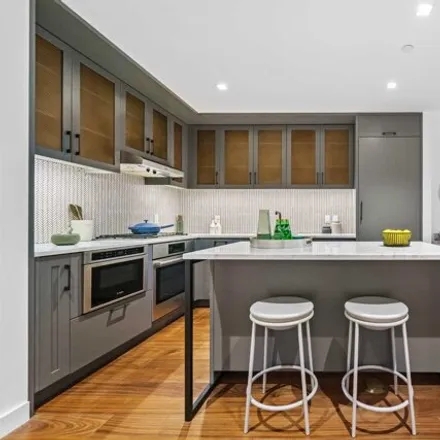
Experience luxury urban living at its finest at 194 Delaware in Jersey City. This meticulously designed home offers 1385 sqft of upscale living space, just moments away from Lincoln Park. Enjoy the convenience of garage parking and your own private b...
$235,000
$235,000
Available: Right Now
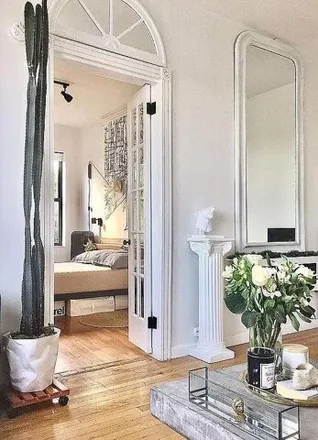
Exquisite Penthouse Retreat Adjacent to Lincoln Park Nestled on the serene and coveted Belvidere Avenue, this penthouse apartment embodies urban luxury with its sun-drenched interiors, modern elegance, and prime location adjacent to the stunning Linc...
$4,15M
$4,15M
Available: Right Now
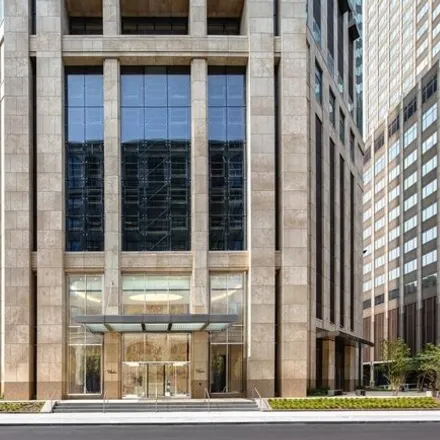
A collaboration between developer China Overseas America and award-winning architect Perkins Eastman, 99 Hudson offers a sophisticated design that redefines luxury living along New Jerseys Gold Coast. Extraordinary in development, 99 Hudson is the ta...
$2,18M
$2,18M
Available: Right Now
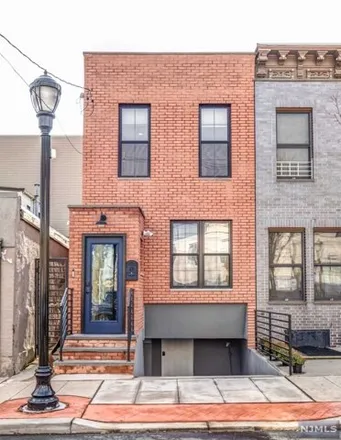
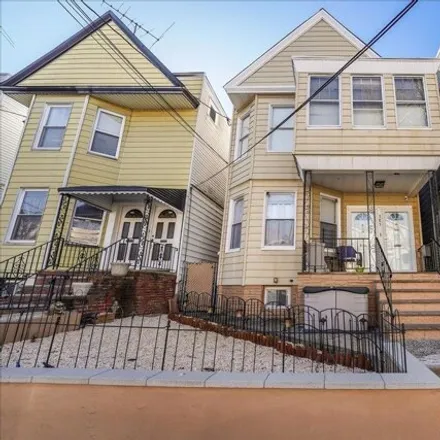
Introducing an outstanding new construction opportunity designed for substantial family living! This expansive two-family residence features ten bedrooms, six full bathrooms, and two half bathrooms, making it a perfect fit for large or multi-generati...
$649,000
$649,000
Available: Right Now
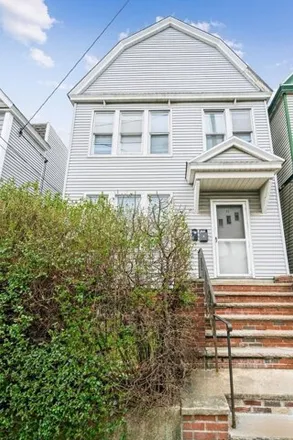
Welcome to this Jersey City two-family home near Bayside Park, with generous living spaces. The first floor which is currently generating rental income, features three bedrooms and one bathroom, showcasing an eat-in kitchen, dining area, and original...
$799,000
$799,000
Available: Right Now
Discover this incredible single family home that boasts an over sized backyard with parking. From the start when you enter this home, you can't help but notice its edgy urban design. This is truly a modern home with elegant details. The home offers y...
$659,000
$659,000
Available: Right Now
Walk-ins will not be accommodated. One deeded parking spot with great location on the 3rd garage floor included in the sale. Apartment #2713 stands out as one of the largest and most sought-after studio apartments in Downtown Jersey City's prestigiou...
$1,1M
$1,1M
Available: Right Now
23 Highland, an Oversized Duplex Unit spanning two true floors and approx. 1, 800sqft of luxurious living space. This home has been built by one Hudson / Union County's premier builders and spares no attention to detail. This home consists of 4 Overs...
$309,000
$309,000
Available: Right Now
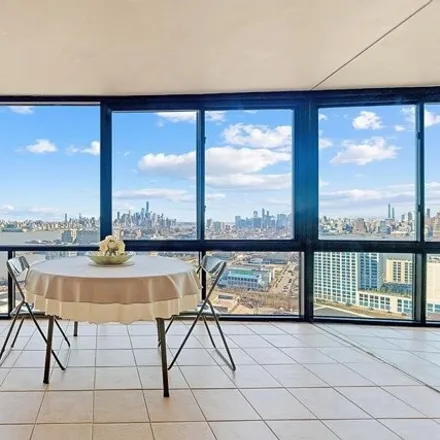
Wow is the word as you step into the living space of this large unit and come face to face with the panorama of NYCs breathtaking skyline! The majesty of midtown skyscrapers and serene blue river water, dotted with ferries, sailboats, and occasional ...
$749,000
$749,000
Available: Right Now
Introducing 39 Boyd Avenue Residence C, a newly constructed luxurious 3 bedroomTRIPLEXthat feels more like a townhome. With red oak hardwood floors throughout, the first of three floors boasts an open kitchen/living space with exquisite soapstone qua...
$875,000
$875,000
Available: Right Now
Indulge in the breathtaking views of the World Trade Center and Hudson River from this sun-drenched, southern exposure duplex, 2 bedrooms and 2.5 baths. Whether basking in the views of downtown NYC from your private balcony or nestling by the real wo...
$849,000
$849,000
Available: Right Now
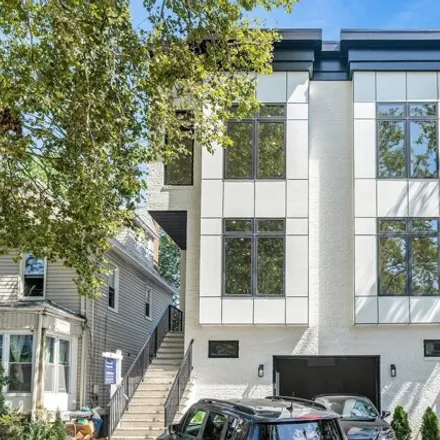
Find the ultimate contemporary urban living in the vibrant Heights neighborhood! This newly constructed 3-unit building boasts a secure entrance on a tree-lined street with access to surrounding Hoboken and NYC access. Each unit offers a spacious 3 (...
$785,000
$785,000
Available: Right Now
Open house by appointment only. In Park and Shore, a South Facing 1 Bed is the Largest in the building and has a fantastic layout with no wasted space! The Chef's kitchen is fitted with top-of-the-line appliances by Bosch including a 5-burner ...
$775,000
$775,000
Available: Right Now
Situated between West Side Avenue and Mallory this Legal 2 Family offers the next owner, both proximity to Lincoln Park, Jersey Citys second largest park, as well as a 10 min walk to the West Side Light Rail station. Steps from neighborhood retail al...
$949,000
$949,000
Available: Right Now
High-end urban living and incredible location come together in these newly renovated homes in Journal Square. Set just one block to the PATH, this two-story, 4 bed residence boasts bonus rooms, loads of square footage and coveted private outdoor spac...
Jersey City
According to statistics, the population in Jersey City, NJ amounts to 265,560, which shows decline -2% compared to the previous year. The median age of the city’s residents is 34. The average household income is $72,561, shifting growth 10% from the past year, and the average property value in Jersey City, NJ growth 10% to $416,900 throughout the year.
| Population | 265,560 |
| Median Age | 34.2 |
| Poverty Rate | 19% |
| Household Income | $72,561 |
| Number Of Employees | 141,780 |
| Median Property Value | $416,900 |
What is the Average Price of Apartments for Sale in Jersey City, NJ?
| Month | Median Price |
|---|---|
| Mar 2024 |
$531,271
|
| Feb 2024 |
$531,271
|
| Jan 2024 |
$531,271
|
| Dec 2023 |
$531,271
|
| Nov 2023 |
$553,714
|
| Oct 2023 |
$584,128
|
| Month | Median Price |
|---|---|
| Mar 2024 |
$621,473
|
| Feb 2024 |
$621,473
|
| Jan 2024 |
$621,473
|
| Dec 2023 |
$621,473
|
| Nov 2023 |
$835,532
|
| Oct 2023 |
$845,604
|
Household Income
The average household income in Jersey City, NJ grew from $66,264 to $72,561 in the past year. This data is an estimate based upon 102,353 households in Jersey City, NJ . The chart below presents how household income is distributed in Jersey City, NJ in comparison to the revenue allocation amid households nationally.
Property Value
According to data from last year, the average property value in Jersey City, NJ shifted from $379,900 to $416,900 throughout the year. The subsequent graph indicates the share of properties in the given price range in Jersey City, NJ in comparison to the median property value in the same price segment across the country. According to the data, the greatest share of Jersey City, NJ properties falls in the 'n/a' range, which is lower than the most significant median property across the country.
Rent vs. Own
Property Taxes
One of the most important aspects for property owners is the amount of property taxes. This graph shows distribution of property taxes in Jersey City, NJ compared to median property taxes around the country. The prevalent amount of property taxes in Jersey City, NJ equals $n/a, which is less than the national average.