Kingsport, TN, USA apartments for sale
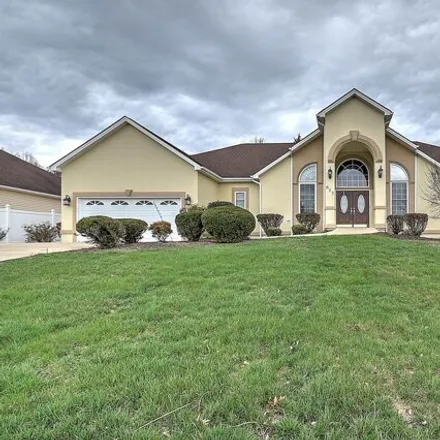
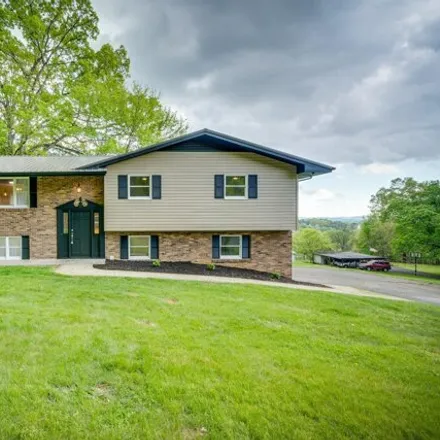
$575,000
$575,000
Available: Right Now
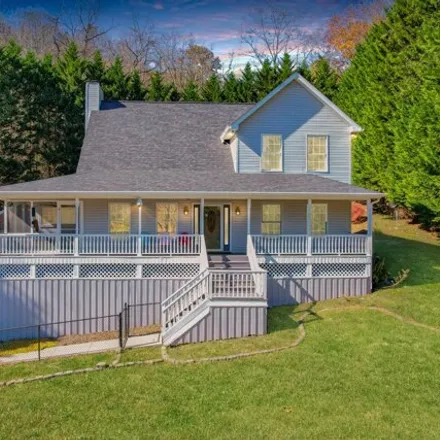
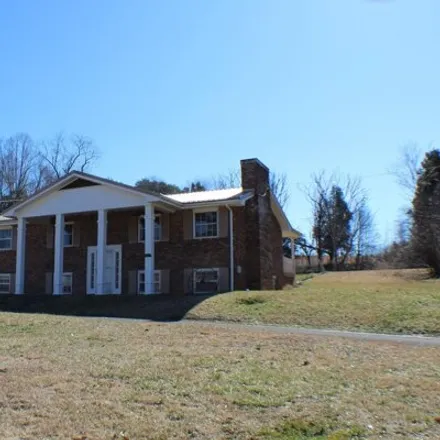
Enjoy the overlook of Gray shopping district At $194 per sq ft, this house is a bargain in today's market. From the moment You Walk Into this house you'll find it's something Special. This Luxurious Estate style home and it's Grand opening Foyer give...
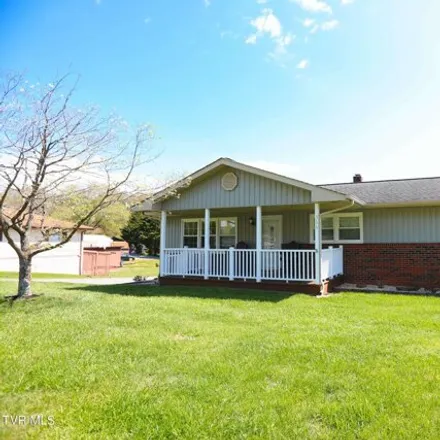
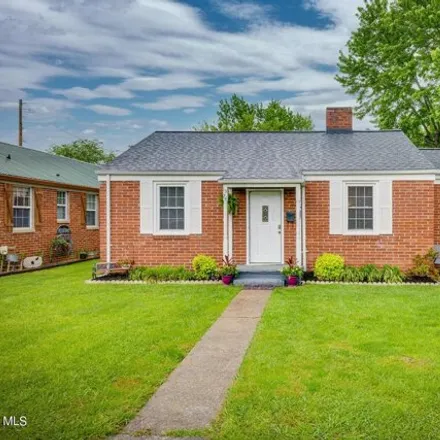
$409,900
$409,900
Available: Right Now
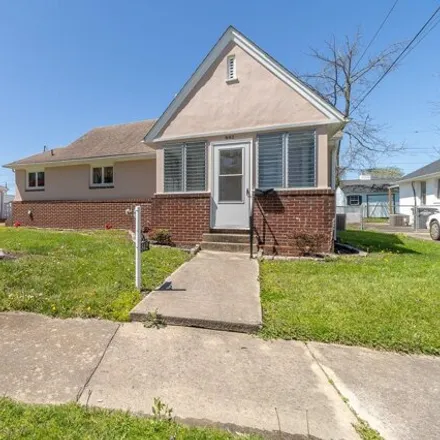
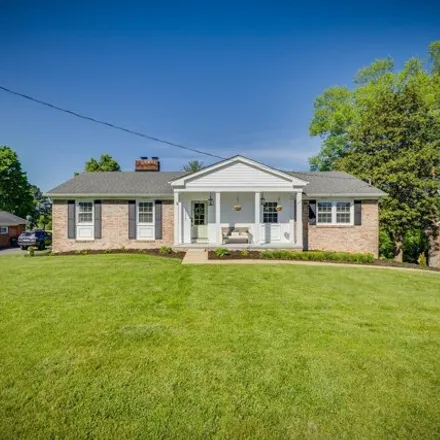
366 East Carters Valley Road is the home you have been waiting to own. The well maintained 3 Bedroom 2.5 Bathroom home welcomes you upon entry. This home has been updated with attention to detail. Included with this home is an 8'X19' covered front po...
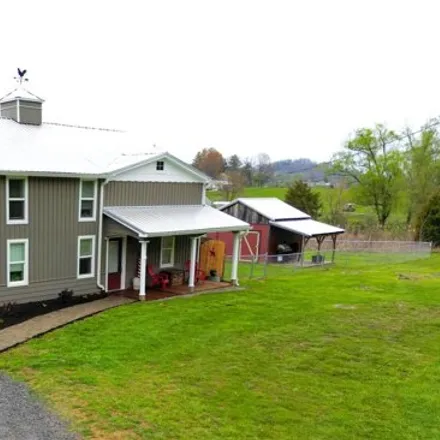
$569,000
$569,000
Available: Right Now
Ready to Fall In LOVE? Welcome to Hallelujah Trail! This home has been meticulously renovated from a Barn to a gorgeous one-of-a-kind home. The owners have painstakingly crafted this into a farmhouse lovers Dream!The property includes 2 parcels with ...
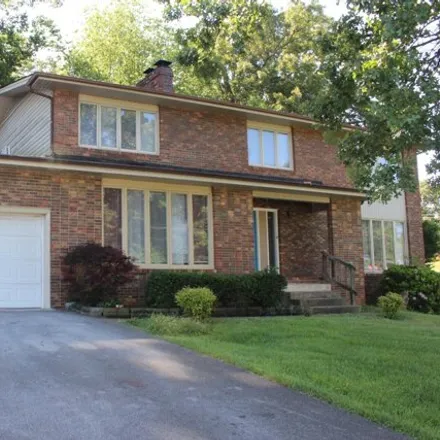
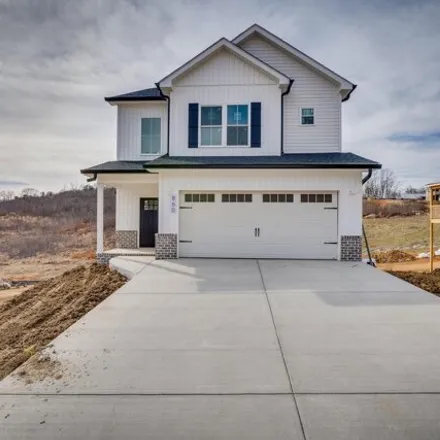
$499,000
$499,000
Available: Right Now
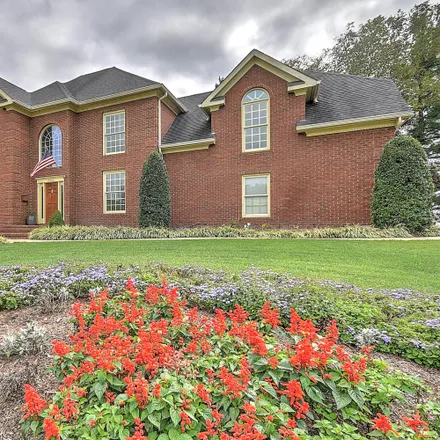
905 Meadow Lane Kingsport, TN 37663,Plantation Manor, Sullivan County. Large two story brick traditional home featuring formal living and dining rooms, kitchen, and breakfast area. Main level den with fireplace. Full bath with laudnry connections. Se...
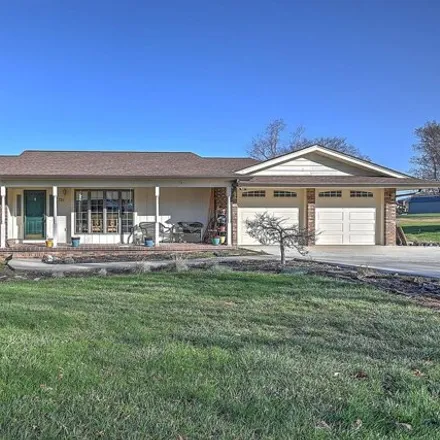
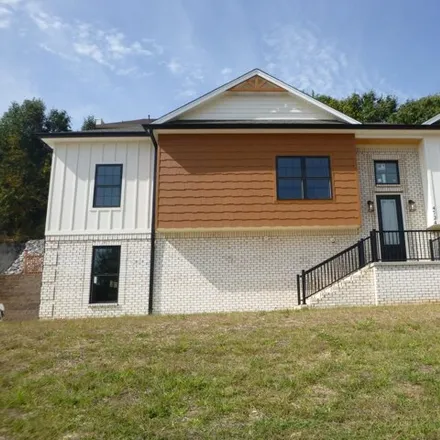
$320,000
$320,000
Available: Right Now
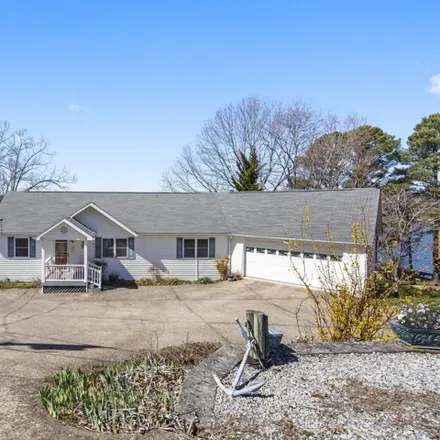
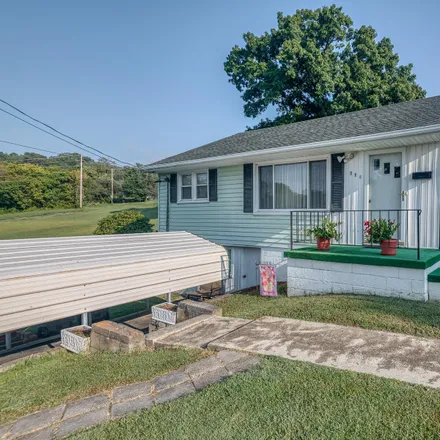
Welcome to your dream home with one of the most breathtaking views in Kingsport! This meticulously remodeled property offers three bedrooms, two full baths, and an array of modern updates that will exceed your expectations. Nestled just outside the c...
$249,000
$249,000
Available: Right Now
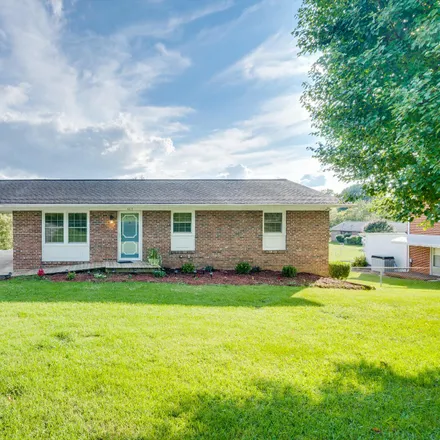
This one level brick home is centrally located in East Kingsport. Just minutes from Eastman, Holston Valley Hospital, Ft Henry Mall, Food City, Fun Fest and so much more. The home is located in the award winning Kingsport City School District. Home f...
$630,000
$630,000
Available: Right Now
Updated one level home with a full basement, double garage attached with New doors 1 year ago and a Huge 2500 sq ft detached garage and Workshop. Walk into the foyer with New tile to the left is the living room with hardwood floo...
$565,000
$565,000
Available: Right Now
Move in ready Upscale Gated Community located in The Birches! This maintenance free end unit offers an outdoor Living Space NO other UNIT has: A private 700sq ftNEW 2 TIERpatio with all custom (pavers) and extensive outdoor lighting which exte...
$870,000
$870,000
Available: Right Now
Welcome home to your very own lake front oasis on Patrick Henry Lake in Colonial Heights!!! This turn key ready home boasts 5 bedrooms and 3 1/2 baths. The master bedroom and laundry are on the main level. It also features a floating boat dock, heate...
$209,900
$209,900
Available: Right Now
Great one level home conveniently located, close to schools, shopping , hospital and downtown. The enclosed porch looks out to Borden Park. Nice settings picnic and play areas. An excellent home for first time buyers or retirees. Pretty fenced in bac...
$229,900
$229,900
Available: Right Now
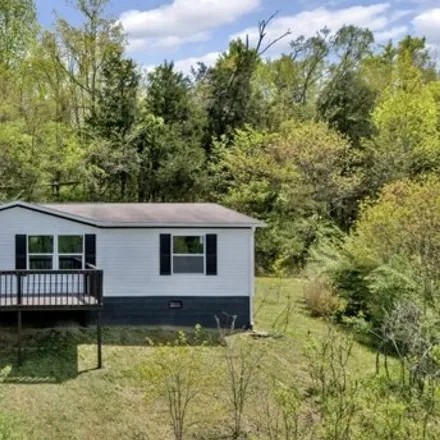
Wooded Private Acreage RemodeledCome check this one out today!! Beautifully remodeled 2016 build 3 large bedrooms 2 beautiful bathrooms, new flooring, windows, paint, vanities, granite countertops, sinks, fixtures, new stainless appliances, the whole...
$549,900
$549,900
Available: Right Now
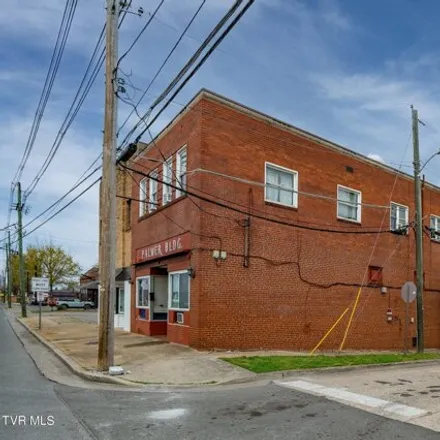
Calling all investors!! This 12 Bedroom 11 bath multi family home is exactly what you're looking for! This property is close to East Stone Drive and Dobyns-Bennett High School! Property needs some TLC but still cash flows, and can cash flow even more...
$434,900
$434,900
Available: Right Now
Welcome to your New Home! The finishing touches are just around the corner! Stunning New Construction 2 Story in Granby Place Subdivision. You are going to fall in love with this 3 Bedroom 2 Bath open floor plan design! PLUS spacious unfinished basem...
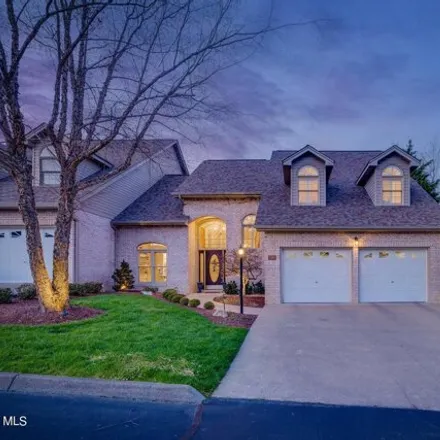
$639,000
$639,000
Available: Right Now
This Spacious 4 Bedrooms, 3 Full Baths, Large Bonus Room on the Second Level with one of the Most Beautiful Main Level Designs with Large Formal Area's that open to the LargeEAT-INKitchen or theWonderful Great Room with a Beautiful Fire Place!...
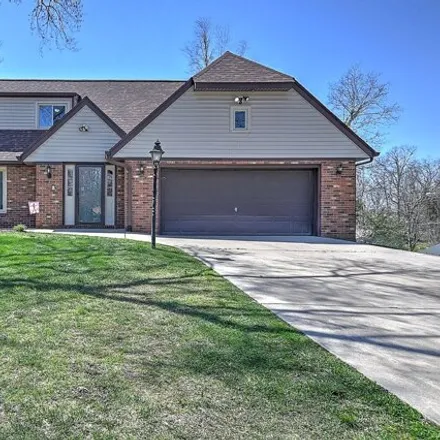
$458,000
$458,000
Available: Right Now
Amazing One-of a-Kind Custom Built Home by Rose Construction with Quality and Beautiful Design! From the time you walk into the front door you will be greeted by luxury! The Iron Staircase is open and whether you go up or down you won't believe this ...
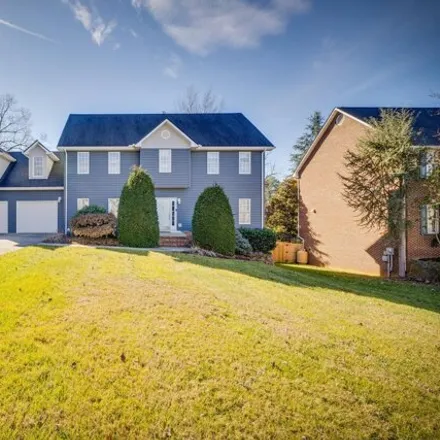
$529,000
$529,000
Available: Right Now
One of kingsports finest Family Neighborhoods! This home is situated on a large corner lot, nice concrete driveway pulls into double garage with attic storage. Walk onto the front porch and wave to the wonderful neighbors as they walk their do...
$750,000
$750,000
Available: Right Now
Lakefront on Main channel ! With gentle access to the water and a fantastic layout, this home features an open concept, vaulted ceilings, and 3 bedrooms with 2 full baths on the main level. A screened porch, deck, laundry, and garage pr...
$485,000
$485,000
Available: Right Now
Welcome home to 2225 Pendragon Road in Kingsport TN! Located directly with backyard views of the Ridgefields golf course/driving range...you will immediately fall in love! This home has been completely updated throughout and is ready for YOU! Crisp, ...
$499,000
$499,000
Available: Right Now
Looking for a home on 11.23 picturesque acres in a quiet area yet close to town? Here it is! With this much acreage, it has so many possibilities with additional room to build and grow. Home has new paint and flooring throughout and both bathrooms re...
$530,000
$530,000
Available: Right Now
$89,000
$89,000
Available: Right Now
$208,000
$208,000
Available: Right Now
Kingsport
According to statistics, the population in Kingsport, TN amounts to 52,698, which shows decline 0% compared to the previous year. The median age of the city’s residents is 44. The average household income is $39,135, shifting decline -1% from the past year, and the average property value in Kingsport, TN decline 1% to $136,000 throughout the year.
| Population | 52,698 |
| Median Age | 44.3 |
| Poverty Rate | 20% |
| Household Income | $39,135 |
| Number Of Employees | 21,306 |
| Median Property Value | $136,000 |
What is the Average Price of Apartments for Sale in Kingsport, TN?
| Month | Median Price |
|---|---|
| Apr 2024 |
$181,244
|
| Mar 2024 |
$181,244
|
| Feb 2024 |
$181,244
|
| Jan 2024 |
$181,244
|
| Dec 2023 |
$153,539
|
| Nov 2023 |
$170,017
|
| Month | Median Price |
|---|---|
| Apr 2024 |
$297,938
|
| Mar 2024 |
$297,938
|
| Feb 2024 |
$297,938
|
| Jan 2024 |
$297,938
|
| Dec 2023 |
$253,490
|
| Nov 2023 |
$279,066
|
Household Income
The average household income in Kingsport, TN declined from $39,463 to $39,135 in the past year. This data is an estimate based upon 23,478 households in Kingsport, TN . The chart below presents how household income is distributed in Kingsport, TN in comparison to the revenue allocation amid households nationally.
Property Value
According to data from last year, the average property value in Kingsport, TN shifted from $134,800 to $136,000 throughout the year. The subsequent graph indicates the share of properties in the given price range in Kingsport, TN in comparison to the median property value in the same price segment across the country. According to the data, the greatest share of Kingsport, TN properties falls in the '$100,000 to $124,999' range, which is lower than the most significant median property across the country.
Rent vs. Own
Property Taxes
One of the most important aspects for property owners is the amount of property taxes. This graph shows distribution of property taxes in Kingsport, TN compared to median property taxes around the country. The prevalent amount of property taxes in Kingsport, TN equals $1150, which is less than the national average.