Lancaster, CA, USA apartments for sale

$589,900
$589,900
Available: Right Now
Welcome to this Beautiful Custome built Home in Lovely Lancaster. This stunning Totally remodeled 5-bedroom, 4 bath Home includes 2 Master bedrooms upstairs each with private baths. One master bedroom downstairs with its own private bathroom, the oth...
$675,000
$675,000
Available: Right Now
Welcome to your dream home in the serene and prestigious community of Quartz Hill! This exquisite 5-bedroom, 3-bathroom residence, built in 2004, boasts timeless elegance and modern comfort. With a recent and comprehensive remodel, this home is in im...

$532,000
$532,000
Available: Right Now
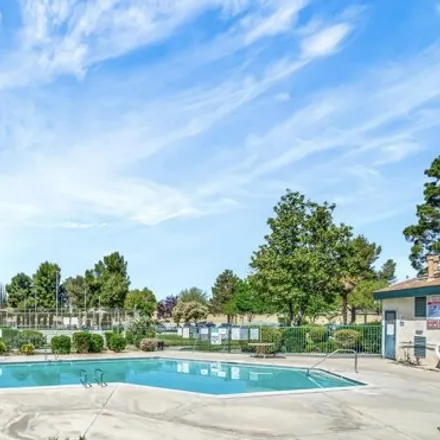
Unique property on the West side boasts a large lot, a pool with jacuzzi, putting green, RV parking/storage (42' length behind gate), two sheds and covered back patio with outdoor tv. Pool replastered and retiled 6 mos. ago and new pool heater. A/C u...
$585,000
$585,000
Available: Right Now
Amazing Family Home! Formal Living and Dining Family Room with fireplace, Open Kitchen with Center Island and Eating Area, Office/Den down with French Doors could easily be a Guest Room along with 1/2 Bath, upstairs 4 Bedrooms (1 does not have a Clos...
$390,000
$390,000
Available: Right Now
Adorable home in West Lancaster. This home is near schools, parks, shopping, etc. This home is situated on a spacious corner lot with tons of parking and a detached 2 car garage. Inside you will find an open floor plan perfect for entertaining. The l...
$974,900
$974,900
Available: Right Now
Escape the ordinary and step into your own private paradise with virtually eliminated electric bills thanks to a super-sized solar system all in this custom single-story estate! Located in West Lancaster, spread across nearly an acre, you'll find a m...

$579,000
$579,000
Available: Right Now
Nestled in the desirable neighborhood of West Lancaster, this welcoming 3-bedroom, 2.5-bathroom pool home offers luxury and comfort. Step inside to a spacious open-concept layout with elegant vinyl flooring. The high ceilings enhance the sense of spa...

$610,000
$610,000
Available: Right Now
Beautiful home in the west side of Lancaster, Built in 2019, Grantie counter tops, plantation shutters through out the whole house, this home is a must see. This home is a 4 bed, 3 bath house in a great neighborhood less than a mile from restaurants ...

$510,000
$510,000
Available: Right Now
Back on the market !! Home sweet home, look no more ! Welcome to this warm and great single story Pool home! Wonderful location in quiet, newer neighborhood of Lancaster. Built in 2006 this home offers 2002 Sq Ft of living space, 4 bedr...
$537,500
$537,500
Available: Right Now
The White Fence Farm Community in West Lancaster offers ranch style living! Exceptional opportunity to own this three bedroom, one bathroom single story home situated on approximately 2.5 acres. Additionally, the home offers an abundance of living sp...
$620,000
$620,000
Available: Right Now
This newly listed ranch home offers the perfect combination of modern upgrades and peaceful outdoor space.This stunning ranch home is nestled on a one-acre property surrounded by mature pine trees, creating a serene and private atmosphere. As you dri...

$879,900
$879,900
Available: Right Now
Calling all horse lovers and hobbyists! This meticulously maintained, single-story home sits on a sprawling 2.3-acre corner lot zoned for horses and other large animals. Enjoy peaceful rural living with convenient access to the 14 Freeway and major s...

$459,000
$459,000
Available: Right Now
Come and see! Discover your dream home with this newly renovated single-story gem! Featuring a new wide driveway, new roof, new kitchen, new entry doors, new water heater, new flooring, new stucco throughout, new dual-pane windows, new recessed light...

$599,000
$599,000
Available: Right Now
The Tierra Bonita Ranch, established circa 1952, boasts a high-producing private rural pumping plant water well per county, emphasizing abundant water access. Located on prime Lancaster Property on 22nd East and Lancaster Blvd, the site offers over 5...

$575,000
$575,000
Available: Right Now
Beautiful and spacious two story home in East Landcaster in a very quiet neighborhood. This home has 5 bedrooms, 3 bathrooms and an additional bonus/game room upstairs. This home has an open floor plan with plenty of room to grow. There is 1 bedroom ...
$410,000
$410,000
Available: Right Now
Adorable home in Lancaster. This home is near schools, parks, shopping, etc. This home features an oversized driveway that you can access from the front of the home and the back of the home. There is a covered front porch and the front of the home is...
$210,000
$210,000
Available: Right Now
This lovely 3-bedroom, 2-bathroom home is located in one of the most well kept parks in Lancaster, Chaparral Mobile Estates. It features 2 living room areas with ceiling fans. Kitchen has lots of cabinets and island. The bedrooms have great size clos...

$439,900
$439,900
Available: Right Now
Charming west lancaster home ready for your family ! You'll love the Rock and Brick Accents in the Front of this Home as well as the Mature Trees. One has a Swing! You enter to the Living Room with Gorgeous Newly Refinished Hardwood Flooring a...
$250,000
$250,000
Available: Right Now
Welcome to this turn key ready newly remodeled 2 bedroom 1 bathroom home. Property has BRAND new dishwasher, flooring, paint, and washer and dryer to stay. Upon entry you are greeted with an open floor plan, with a patio, and fireplace. Bedrooms are ...

$545,000
$545,000
Available: Right Now
Super clean - this fine home boasts spacious living room with custom tile flooring and gas fireplace, large formal dining room, huge family room with fireplace, gorgeous / spacious kitchen with granite type counter tops and beautiful cabinetry...

$541,948
$541,948
Available: Right Now
Step inside this exquisite new construction 3 bedroom, 2 bathroom single family home situated in a prime location. As you step through the door, you'll be met with stunning landscaping outside and a spacious open concept layout complete with luxury v...

$299,900
$299,900
Available: Right Now
Welcome to the gated Pinecreek Village condominium community in West Lancaster. This inviting home features 2 bedrooms and 2 bathrooms, with 936 square feet of living space designed for family enjoyment. The family room includes a fireplace, perfect ...
Lancaster
According to statistics, the population in Lancaster, CA amounts to 160,113, which shows decline 0% compared to the previous year. The median age of the city’s residents is 32. The average household income is $49,314, shifting growth 3% from the past year, and the average property value in Lancaster, CA growth 15% to $213,100 throughout the year.
| Population | 160,113 |
| Median Age | 32.4 |
| Poverty Rate | 23% |
| Household Income | $49,314 |
| Number Of Employees | 56,062 |
| Median Property Value | $213,100 |
What is the Average Price of Apartments for Sale in Lancaster, CA?
The average sale price for apartment in Lancaster, CA: $139,871
(-12.4%)
| Month | Median Price |
|---|---|
| Jun 2024 |
$147,585
|
| May 2024 |
$159,727
|
| Apr 2024 |
$146,885
|
| Mar 2024 |
$146,885
|
| Feb 2024 |
$146,885
|
| Jan 2024 |
$146,885
|
| Month | Median Price |
|---|---|
| Jun 2024 |
$139,871
|
| May 2024 |
$159,727
|
| Apr 2024 |
$147,271
|
| Mar 2024 |
$147,271
|
| Feb 2024 |
$147,271
|
| Jan 2024 |
$147,271
|
Household Income
The average household income in Lancaster, CA grew from $47,684 to $49,314 in the past year. This data is an estimate based upon 48,124 households in Lancaster, CA . The chart below presents how household income is distributed in Lancaster, CA in comparison to the revenue allocation amid households nationally.
Property Value
According to data from last year, the average property value in Lancaster, CA shifted from $186,000 to $213,100 throughout the year. The subsequent graph indicates the share of properties in the given price range in Lancaster, CA in comparison to the median property value in the same price segment across the country. According to the data, the greatest share of Lancaster, CA properties falls in the '$200,000 to $249,999' range, which is higher than the most significant median property across the country.
Rent vs. Own
Property Taxes
One of the most important aspects for property owners is the amount of property taxes. This graph shows distribution of property taxes in Lancaster, CA compared to median property taxes around the country. The prevalent amount of property taxes in Lancaster, CA equals $3000, which is less than the national average.