Livonia, MI, USA apartments for sale
$137,995
$137,995
Available: Right Now
Outstanding Non Smoker, no pets , one bedroom one bathroom condo in Livonia. Contemporary carpeting leads upstairs and through-out living area. The kitchen has dual entry from living room and dining room. Close to grocery stores, restaurants, highway...

$229,900
$229,900
Available: Right Now
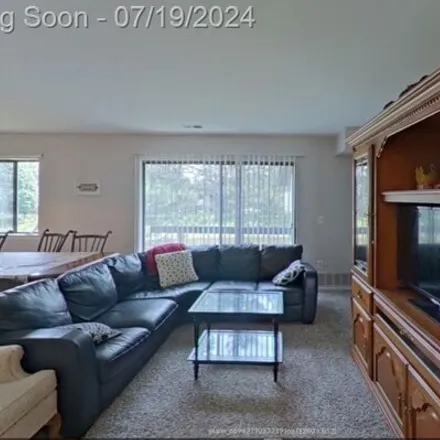
A true turn key Livonia ranch!!!! Walk right into this amazing open floor plan with a large eat in kitchen that flows right into the living area. Recent updates include paint, flooring, kitchen, bathroom, furnace, AC, roof and much more. Relax in you...

$184,900
$184,900
Available: Right Now
This charming ranch in Livonia is an ideal starter home or investment property. A cozy home in the Livonia School District offering 3 bedrooms, 2 full bathrooms and a living room that opens up to the dining room giving a spacious feel to the layout. ...
$2,250
$2,250
Available: Right Now
Welcome to your new home in the heart of Livonia, Michigan! This charming 3-bedroom residence is now available for lease, offering a perfect blend of comfort, style, and convenience. Nestled in a family-friendly neighborhood, this home boasts a welco...

$250,000
$250,000
Available: Right Now
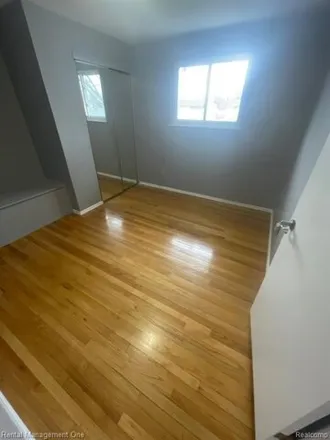
Welcome to Bennett Street! This lovingly cared for home boasts 3 bedrooms, 1 full bath, and 1 half bath, offering comfort and convenience. Step inside and be greeted by a bright living space with beautiful hardwood floors. The wide-open finished base...

$239,000
$239,000
Available: Right Now
Welcome to 19630 Merriman Court, a charming 2-bedroom, 2-bathroom ranch nestled on a serene, shady tree-lined street in the heart of Livonia. Rare to find country living in the city! Situated on a sprawling 3/4-acre double lot, this home provides amp...

$250,000
$250,000
Available: Right Now
Welcome home to this handyman special!!! This brick ranch offers THREE bedrooms and a 1.5 baths. As you enter you will notice tons of vintage charm, and a spacious living area creating an inviting ambiance for relaxation and gatherings. Find comfort ...

$175,000
$175,000
Available: Right Now
Updated Livonia home near Joy and Middlebelt with Livonia Schools. Three bedrooms and one full bath. Updated kitchen with granite counters and updated backsplash, updated flooring on first floor and hardwood floors on second floor. Detached two car g...

$485,000
$485,000
Available: Right Now
Beautiful move in ready, Francavilla Sub Tudor wins best of Livonia! This4BDR/2.5 BAwith Library (possible 5th bedroom) is simply gorgeousINSIDEand OUT! Main floor laundry, oversized garage, huge fireplace, generous closet space! Fully remo...

$469,000
$469,000
Available: Right Now
Presenting a spacious and elegant living experience in Livonia's friendly Windridge neighborhood. This exquisite 4-bedroom residence wonderfully combines the essentials of todays lifestyle with the traditions youd expect of an American colonial-style...

$244,900
$244,900
Available: Right Now
This 3 bedroom brick ranch is clean, updated and move-in ready! Stunning Kitchen with lots of natural light, white shaker cabinets, and gorgeous quartzite counters. Spacious Family Room features a natural Fireplace and large picture window. Nicely si...

$355,000
$355,000
Available: Right Now
Fantastic ranch in Livonia on just under a half acre lot. The signature updates of this house include the updated kitchen, large dining area, and large family room with lots of windows for viewing your spacious back yard. Sellers set up the formal li...

$799,000
$799,000
Available: Right Now
Open house July11, 245pm-7pm. 4870 square feet house, Located in a highly sought after area, this home sits on.66 of an acre in a park-like setting. Perfect for family gatherings, hosting friends or relaxing evenings. Whether it's a cozy night by the...

$125,500
$125,500
Available: Right Now
Incredible value meets convenient location. Close to shopping and freeways. Bright and spacious upper unit located in On the Pond condominium. Enjoy sitting out on a private patio. All appliances stay. Full sized, in unit laundry room. Very spacious ...

$379,999
$379,999
Available: Right Now
Home just appraised for $382k! Welcome to 15008 Yale St, where modern updates meet natural serenity. This meticulously maintained and updated home has it all with a gorgeous interior design, rare wooded backyard with a walking trail, finished garage,...

$275,000
$275,000
Available: Right Now
Welcome to this delightful Livonia brick ranch, ready for you to move in and enjoy! This home features three bedrooms, One and a half baths, and boasts charming curb appeal. Meticulously cared for, it showcases a host of appealing features and has be...

$279,900
$279,900
Available: Right Now
This beautiful large corner lot ranch has four bedrooms and two full baths. This home has so much to offer, with an open, updated, eat-in kitchen that overlooks the large living room and door wall to the very pretty deck and backyard. Three nice-size...
$135,000
$135,000
Available: Right Now
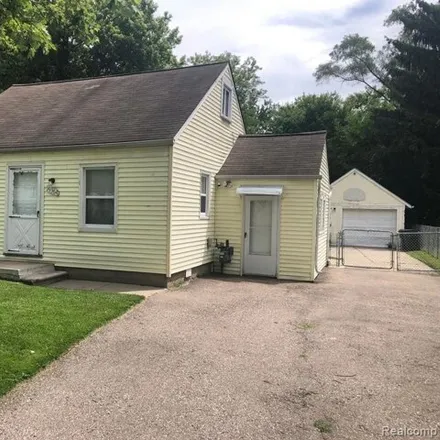
Land contract only ! Terms negotiable with down payment amount and credit score. Seller would prefer 10 years of payments with small balloon at the end. Buyer will be responsible for water and taxes outside of rental payment. Nice size bungalo...

$749,900
$749,900
Available: Right Now
Rare, custom-built craftsman colonial located in the prestigious Halstead Hollow sub-division. This home is conveniently close to shopping, dining and entertainment with easy highway access. Enjoy the open floor plan equipped with 9ft ceilings and ha...

$289,900
$289,900
Available: Right Now
Great Livonia Location on Quiet Dead End street. This 3 Bedroom brick Ranch has been tastefully updated over the years. Updated Full main floor bathroom, New Bay Window, New hot water tank, Updated Kitchen countertops, newer appliances. Kitchen offer...

$299,000
$299,000
Available: Right Now
Welcome to this stunning, fully renovated ranch nestled in the tranquil neighborhood of Livonia. This spacious home boasts impressive curb appeal with its sprawling landscaping. The open kitchen concept features high-end finishes and overlooks the sp...

$299,900
$299,900
Available: Right Now
Hurry, Wont Last Long! This attractive and lovingly maintained 4 bedroom, 1.75 bath home offers many features including the nicely landscaped yards with in-ground sprinklers, the neutral dcor with updated windows and exterior doors, updated bathrooms...
Livonia
According to statistics, the population in Livonia, MI amounts to 94,708, which shows decline 0% compared to the previous year. The median age of the city’s residents is 46. The average household income is $74,882, shifting growth 5% from the past year, and the average property value in Livonia, MI growth 5% to $170,500 throughout the year.
| Population | 94,708 |
| Median Age | 45.7 |
| Poverty Rate | 5% |
| Household Income | $74,882 |
| Number Of Employees | 48,147 |
| Median Property Value | $170,500 |
What is the Average Price of Apartments for Sale in Livonia, MI?
| Month | Median Price |
|---|---|
| Jun 2024 |
$301,149
|
| May 2024 |
$325,583
|
| Apr 2024 |
$328,049
|
| Mar 2024 |
$328,049
|
| Feb 2024 |
$328,049
|
| Jan 2024 |
$328,049
|
Household Income
The average household income in Livonia, MI grew from $71,063 to $74,882 in the past year. This data is an estimate based upon 37,186 households in Livonia, MI . The chart below presents how household income is distributed in Livonia, MI in comparison to the revenue allocation amid households nationally.
Property Value
According to data from last year, the average property value in Livonia, MI shifted from $162,000 to $170,500 throughout the year. The subsequent graph indicates the share of properties in the given price range in Livonia, MI in comparison to the median property value in the same price segment across the country. According to the data, the greatest share of Livonia, MI properties falls in the '$150,000 to $174,999' range, which is lower than the most significant median property across the country.
Rent vs. Own
Property Taxes
One of the most important aspects for property owners is the amount of property taxes. This graph shows distribution of property taxes in Livonia, MI compared to median property taxes around the country. The prevalent amount of property taxes in Livonia, MI equals $3000, which is less than the national average.