Lowell, AR, USA apartments for sale
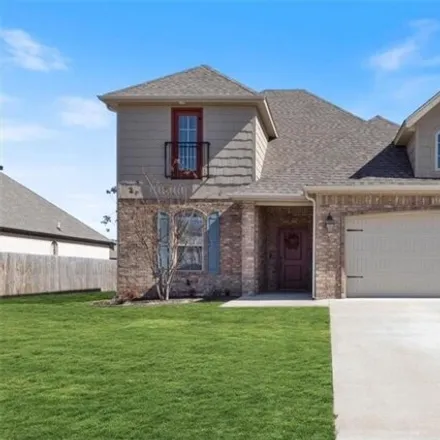
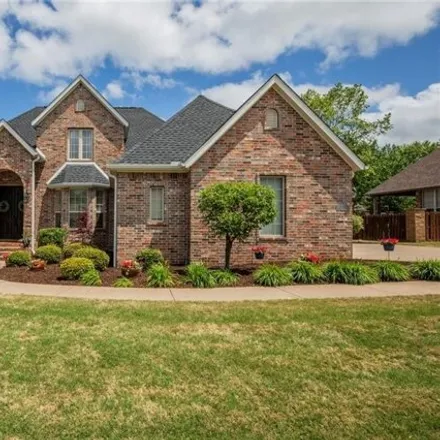
$449,900
$449,900
Available: Right Now
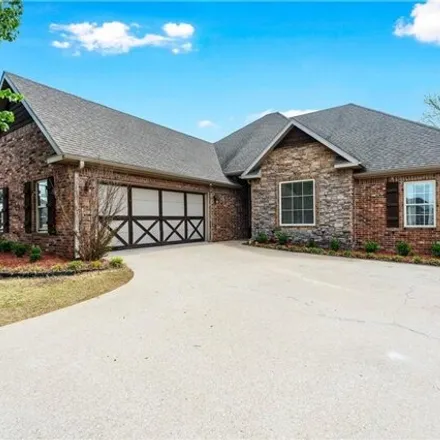
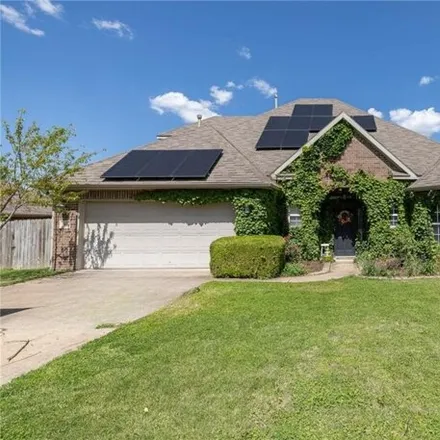
Nestled on a large.39-acre corner lot, this home offers the perfect blend of convenience and luxury. Situated near popular attractions including Top Golf, Walmart Amp, and the Pinnacle Promenade! Handicap accessible features! Newly built, this modern...

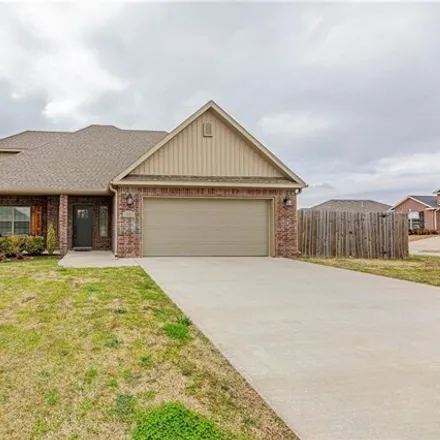
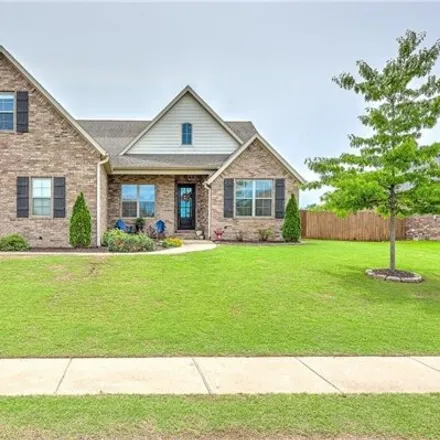
$365,000
$365,000
Available: Right Now
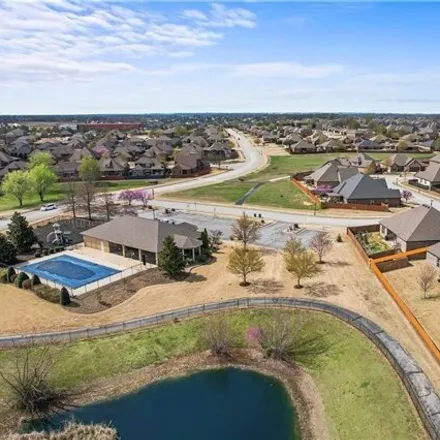
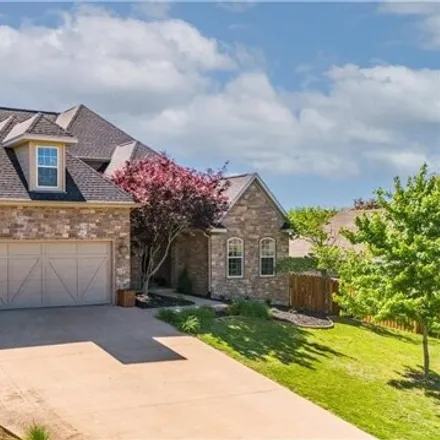
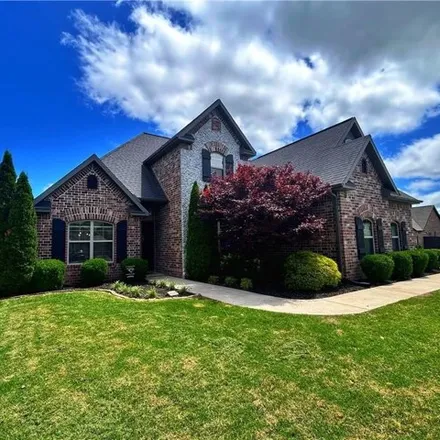
Location can't be beat on this well designed 3 bed, 2 bath home that provides instant curb appeal with its brick and rock exterior and professionally landscaped entrance. The open concept split floor plan is ideal for entertaining with the gas log fi...
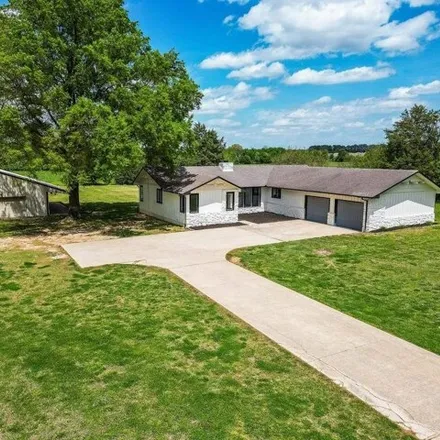
$575,000
$575,000
Available: Right Now
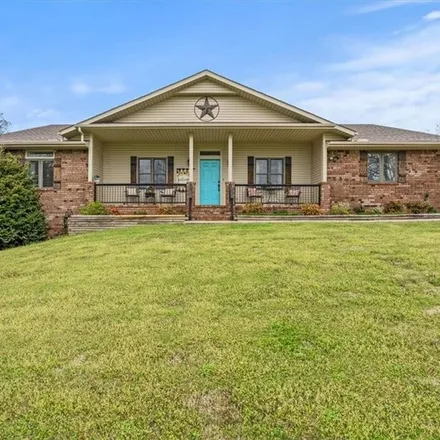
House- check. Shop- check. Land- check. This one is special! Take a look at the 4 bedroom/2 bathroom home sitting on 2.89 acres in the middle of Rogers. Talk about an amazing location with enough land to feel like you are away from the hustle and bus...
$459,900
$459,900
Available: Right Now
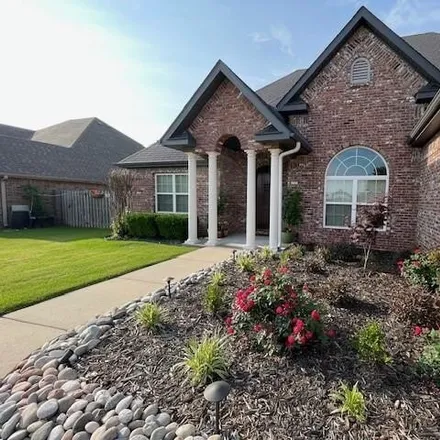
Don't miss the opportunity to live in this home built in 2020 and enjoy the great neighborhood which includes community pool, playground and clubhouse. They have many community events through out the year! Upon entering the house you will notice the ...

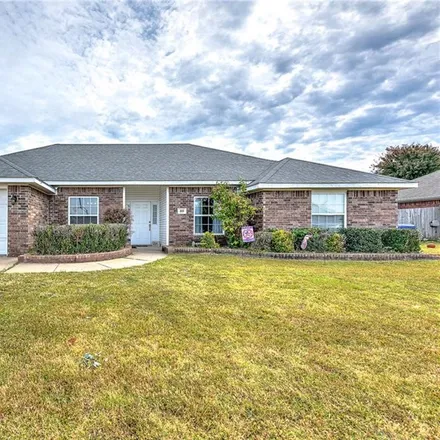
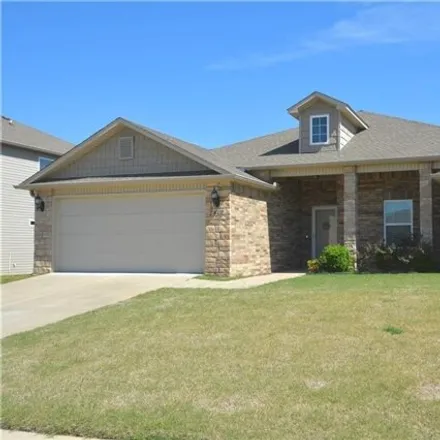
$315,000
$315,000
Available: Right Now
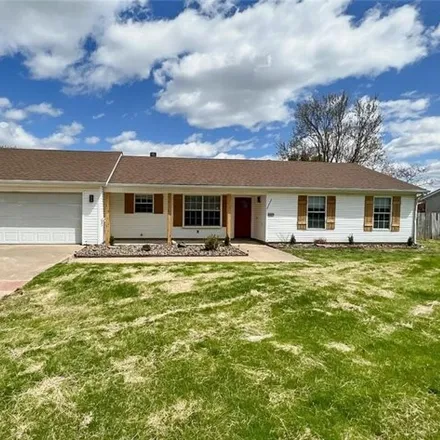
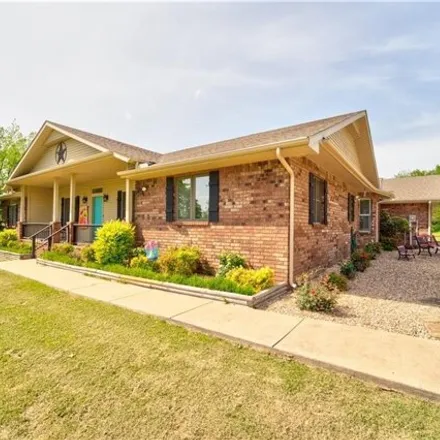
Come check out this great 3 bed 2 bath home in the heart of Lowell. Close to downtown Rogers. It has new paint throughout as well as new carpet and both bathrooms have been totally updated with a soaker tub in the master bath. Good sized master bedro...

$280,000
$280,000
Available: Right Now
Welcome to your dream home on a spacious corner lot! This charming residence boasts 3 bedrooms, 2 baths, and a 2-car garage, spanning 1412 sq ft of comfortable living space. Step inside to discover wood laminate, ceramic tile, and LVP flooring throug...
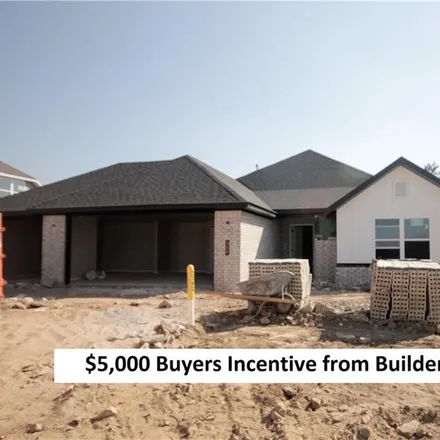
$300,000
$300,000
Available: Right Now
$594,900
$594,900
Available: Right Now
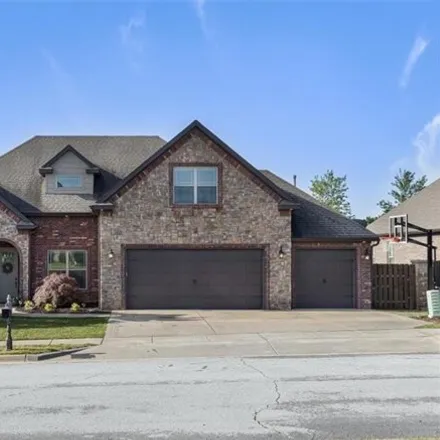
Step into serenity with this stunning house nestled in the coveted Creekwood neighborhood, backing up to a scenic pasture view. A prime location between the neighborhood pool and park, this residence offers the perfect balance of convenience and tran...
$597,500
$597,500
Available: Right Now
Welcome to your dream home in the sought-after Cross Creek subdivision! This stunning 4-bedroom, 2.5-bathroom home offers the perfect blend of comfort and luxury. Step into a spacious living area with beautiful granite accents throughout. The fully s...
$535,000
$535,000
Available: Right Now
Beautiful brick 3 bedroom, 2 bath, split floor plan with 3 car garage and bonus room (over garage) in gated Edinburgh Subdivision. All wood doors and molding throughout. Cozy up to your double-sided fireplace from the living area or in eat-in kitchen...
$764,000
$764,000
Available: Right Now
My favorite floorplan on quiet cul-de-sac in sought after Cross Creek walking and/or biking distance to top ranked Janie Darr Elementary and new Mt. Hebron Park featuring pickle ball, basketball, baseball and soccer fields and expansive kids park wit...
$750,000
$750,000
Available: Right Now
This beautiful 4 bedroom, 3.5 Bath, Cross Creek home is a must see! With two separate living areas, formal dining, private study, as well as an over sized bonus room. Inside youll find hardwood floors, elegant crown molding and tongue and groove ceil...
$495,000
$495,000
Available: Right Now
This 3 bed, 2 bath residential home zoned commercial is ideal for a family looking to run an at-home business. The main home has been completely and carefully redone: from flooring, bathrooms, kitchen, and finishes. Sitting on 1.76 Acres. This 1880 S...
$489,000
$489,000
Available: Right Now
Newly remodeled house with endless opportunities. This 5 bedroom, 3.5 bath house has everything you need, pool, mother-in-law suite/pool house, tons of storage with1, 200of attic storage, deck and bar area for entertainment,.5 acre yard for activitie...
$775,000
$775,000
Available: Right Now
$799,999
$799,999
Available: Right Now
There's not many opportunities to check every box on your home search but this one will check every one. Just under 3600 sq ft with 5 bedrooms with walk-in closets in each one, 4.5 baths with a great layout. 2 bedrooms down stairs, 3 beds up with a l...
$525,000
$525,000
Available: Right Now
Check out this amazing 4 bedroom (fourth can be bonus or bedroom), 2.5 bath home with a formal office space in the sought after Tuscan Heights Subdivision. This home boasts of an open floor plan, tall ceilings, 3 bedrooms on main floor, bonus or 4th ...
$394,990
$394,990
Available: Right Now
Wonderful 1 level home with with lots of updates throughout , including newer flooring and upgraded lighting package. Open kitchen features granite countertops with island , lots of cabinet storage and pantry.Split bedroom floorpan , large primary su...
$357,175
$357,175
Available: Right Now
$370,000
$370,000
Available: Right Now
Remarkable home offers endless potential with beautiful details throughout! Situated on a large privacy fenced lot and located in a fantastic neighborhood that's just a stone's throw from the vibrant Promenade, The Amp, and convenient to I-49! Step i...
$640,000
$640,000
Available: Right Now
Newly remodeled 4 bedroom, 3 bath home in desirable neighborhood of NWA. This beautiful home is energy efficient, with open concept, including kitchen, living room, and breakfast nook. Center island and custom cabinets throughout with pantry, gas coo...
$785,000
$785,000
Available: Right Now
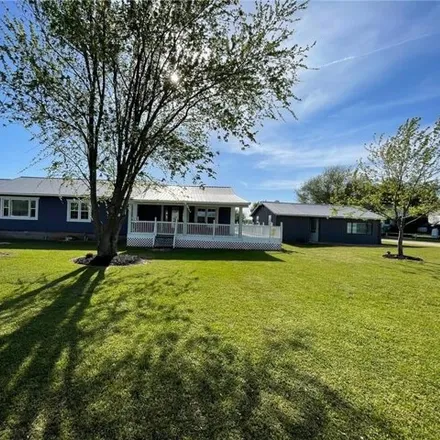
Don't miss a chance at this 6.45-acre private, secluded property in the middle of Rogers! With a spacious inside, a detached shop, and a covered patio, this property has it all. You will be hard pressed to beat this location being just minutes from a...
Lowell
According to statistics, the population in Lowell, AR amounts to 8,622, which shows growth 4% compared to the previous year. The median age of the city’s residents is 31. The average household income is $64,444, shifting growth 14% from the past year, and the average property value in Lowell, AR growth 8% to $146,700 throughout the year.
| Population | 8,622 |
| Median Age | 31.2 |
| Poverty Rate | 8% |
| Household Income | $64,444 |
| Number Of Employees | 4,584 |
| Median Property Value | $146,700 |
What is the Average Price of Apartments for Sale in Lowell, AR?
| Month | Median Price |
|---|---|
| Apr 2024 |
$310,705
|
| Mar 2024 |
$310,705
|
| Feb 2024 |
$310,705
|
| Jan 2024 |
$310,705
|
| Dec 2023 |
$300,707
|
| Nov 2023 |
$264,999
|
| Month | Median Price |
|---|---|
| Apr 2024 |
$409,496
|
| Mar 2024 |
$409,496
|
| Feb 2024 |
$409,496
|
| Jan 2024 |
$409,496
|
| Dec 2023 |
$396,401
|
| Nov 2023 |
$403,187
|
Household Income
The average household income in Lowell, AR grew from $56,557 to $64,444 in the past year. This data is an estimate based upon 3,008 households in Lowell, AR . The chart below presents how household income is distributed in Lowell, AR in comparison to the revenue allocation amid households nationally.
Property Value
According to data from last year, the average property value in Lowell, AR shifted from $136,300 to $146,700 throughout the year. The subsequent graph indicates the share of properties in the given price range in Lowell, AR in comparison to the median property value in the same price segment across the country. According to the data, the greatest share of Lowell, AR properties falls in the '$125,000 to $149,999' range, which is higher than the most significant median property across the country.
Rent vs. Own
Property Taxes
One of the most important aspects for property owners is the amount of property taxes. This graph shows distribution of property taxes in Lowell, AR compared to median property taxes around the country. The prevalent amount of property taxes in Lowell, AR equals $1150, which is less than the national average.