Memphis, TN, USA apartments for sale
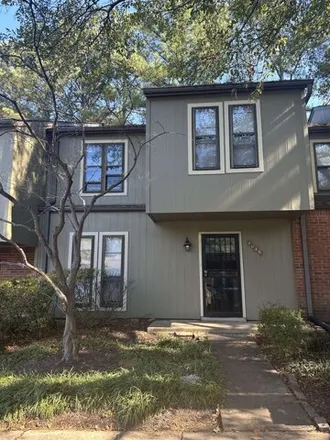
$124,900
$124,900
Available: Right Now
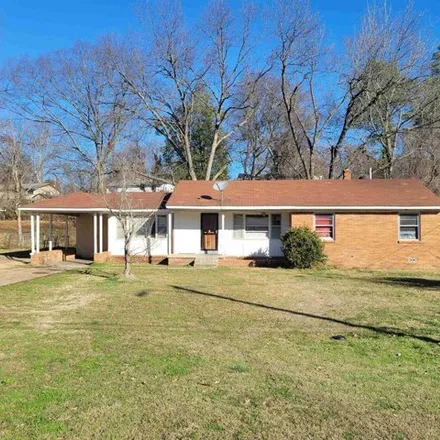
Discover the potential of 2686 James Rd, MemphisTN 38128.With its prime location and spacious layout, this property offers 3 bedrooms, 1.5 bath, and ample room for customization. Home has potential to be a 5-bedroom 2 full bath home with all the spac...
$169,900
$169,900
Available: Right Now
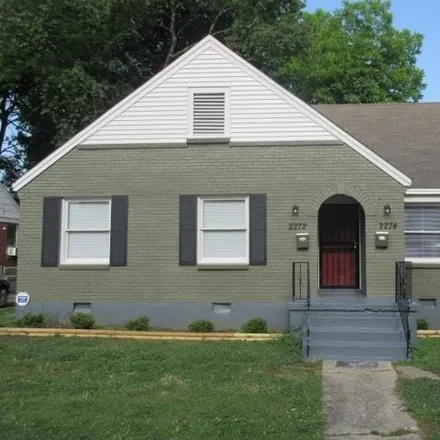
Investors only !! Do not disturb tenant. Duplex Rented for$1, 590/month, professionally managed. Near desirable Cooper-Young Neighborhood. Unit 2272 rented for $795, lease expires3/31/2025,tenant moved in6/3/2016.Unit 2274 rented for $7...
$374,900
$374,900
Available: Right Now
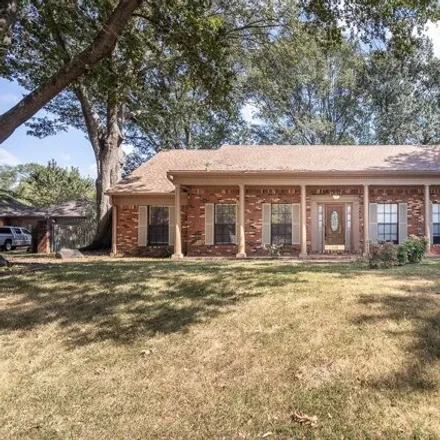
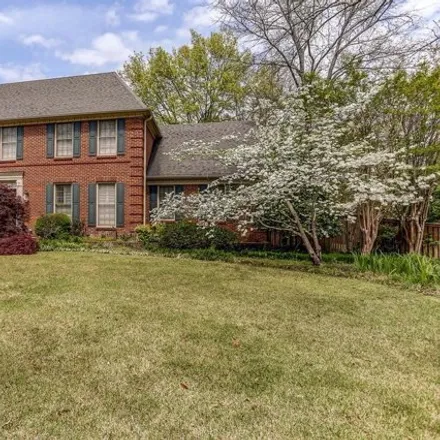
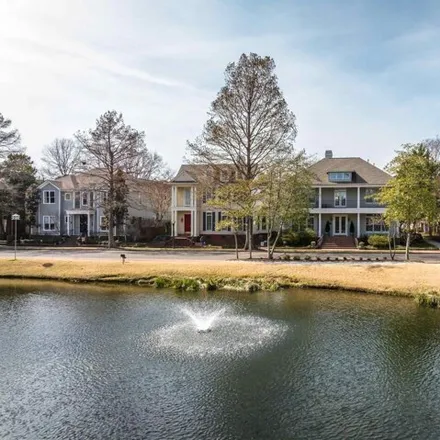
Fabulous opportunity to live in Countrywood. Two bedrooms down, two bedrooms up. Separate living, dining and den with fireplace. Large kitchen with lots of kitchen cabinets and drawers. Separate laundry room. Large gunite pool with patio is perfect f...

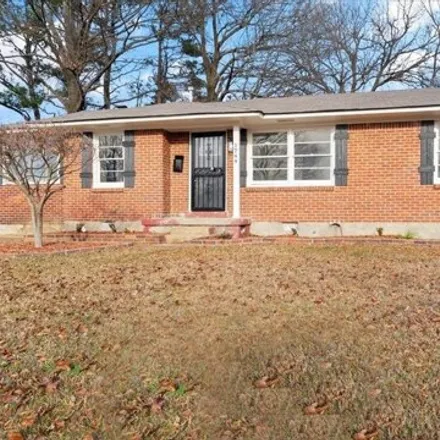
$90,100
$90,100
Available: Right Now
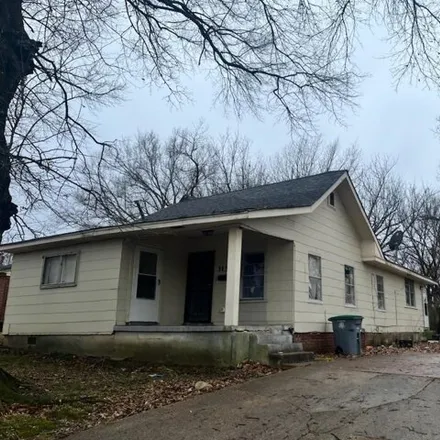
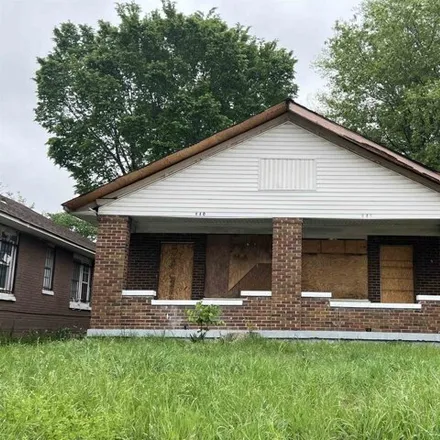
4 bedrooms and 1 1/2 bathrooms (Tax data is incorrect). New Roof, New Window AC units, brand new floors installed Feb 2024, and new cabinets in kitchen. Move in Ready. Prefer to sell as a packed deal with 3579 Lanette Rd (MLS#10162929), 1656 W Shelby...
$825,000
$825,000
Available: Right Now
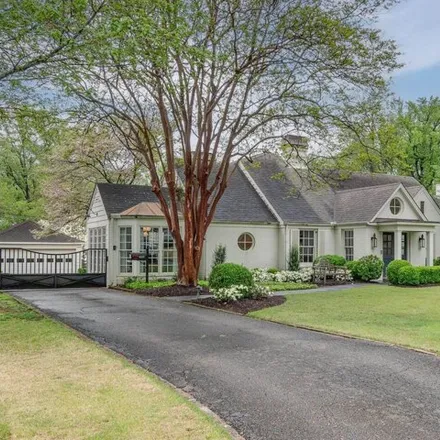
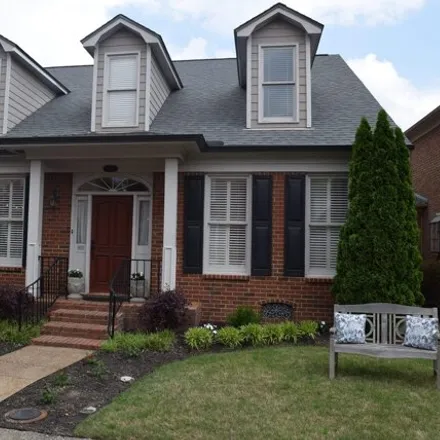
Sophisticated and Timeless! Thoughtful renovations with family and entertaining in mind keep this home current yet comfortable. The attention to detail is evident; large living spaces, fabulous fresh fixtures co mingle with original hardware and wood...
$379,000
$379,000
Available: Right Now
WOW!! Must see home !! village neighborhood setting!!! County Taxes Only! Upgraded kitchen w/ upgraded cabinets, granite counters, tile back splash, and ss appliances. New limestone FP mantle, new hardwood floors throughout, new light and plum...
$749,000
$749,000
Available: Right Now
Very spacious home on large lot in gated and guarded community of Southwind, home of the Fedex St. Jude Golf Championship! 2 primary bedrooms both upstairs and downstairs. Complete with 4 bedrooms and 4 private baths. Very large closets. Two staircas...
$78,333
$78,333
Available: Right Now
Large Bedrooms! 3Bedrooms, 1 Bath home. Accepted contract must be in place for showings. Do not disturb tenants. Contact agent for more information. Realtor Remarks! No showing without accepted offer. Tenants rights, do not disturb. Rent $675/Month. ...
$225,000
$225,000
Available: Right Now
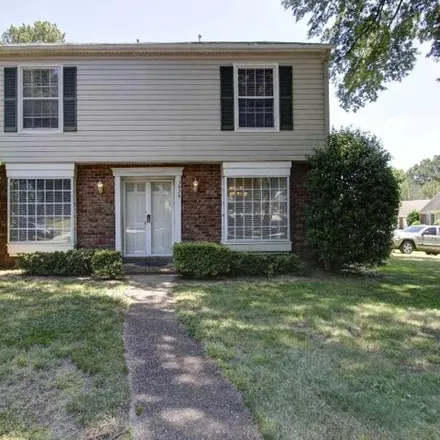
Back on market. No fault of the Seller. Room for the entire family! Large Corner Lot with mature trees, 4 bedrooms 2.5 bathrooms, tiled floors in kitchen and an oversized den and a formal dining and living rooms. The space this home has to offer is a...
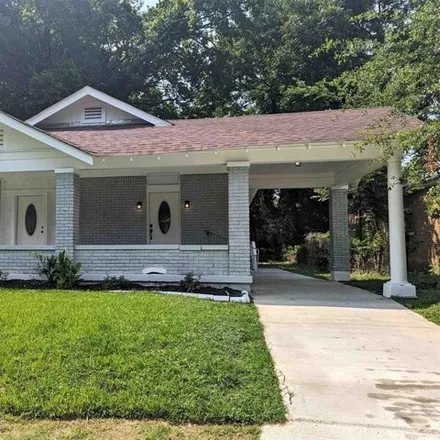
$199,000
$199,000
Available: Right Now
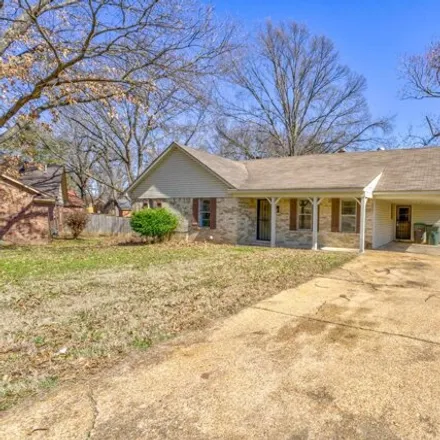
Tucked away between Annesdale and Cooper Young for under 200K!!! is this All brick and fully renovated hidden gem with covered carport! 3bd/2ba great for Single Family but for a savvy investor it could easily be a 4bd/2ba and convert back to d...
$189,900
$189,900
Available: Right Now
This is a meticulously renovated 3-bed, 1-bath home in the heart of East Memphis. This residence seamlessly blends classic charm with modern updates. This property has a living room and a bonus family room. The primary bedroom is a serene retreat, an...
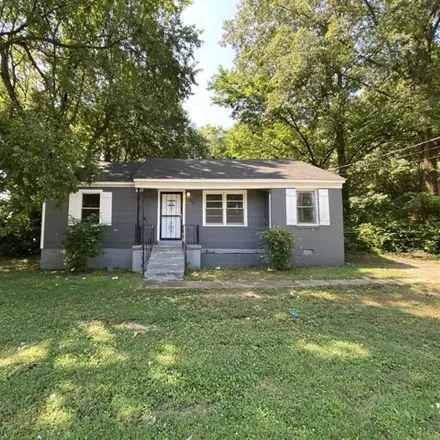
$115,000
$115,000
Available: Right Now
Reduced Price! Currently rented! Completely renovated home featuring new AC, roof and HWH, updated kitchen and sewer system. Perfect for first time home buyers or investors. Can be bought individually or in a package of updated homes from teh seller....
$439,900
$439,900
Available: Right Now
Looking for a spacious 3bd/3ba home, (over 2700 sqft on one level!) on a premier East Memphis street- look no further! Situated on 1/2 acre corner lot w easy access onto Normandy w circular drive, 2car grge, laundry rm w storage, ample parking and hu...
$775,000
$775,000
Available: Right Now
Great location in Harbor Town! Close to walking trails along the Miss River, Greenbelt Park, Harbor Town Square and Downtown. Stunning 4 bd/3.5 bth home, new quartz countertops, new tile backsplash, new light fixtures and new interior paint throughou...
$208,900
$208,900
Available: Right Now
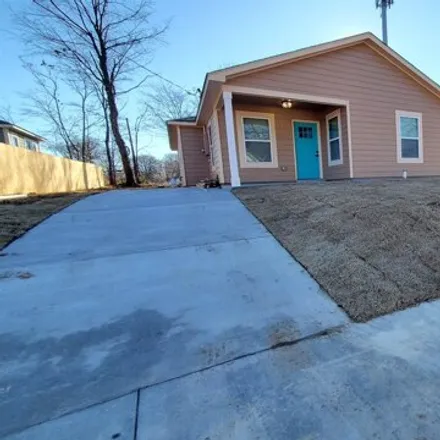
This is a wonderful opportunity to own a new construction home for Less than rent in most cases! The floor plan features a spacious Living Room, great for gatherings and entertainment, with an open-plan w/ site lines to the eat-in kitchen. This newly...
$264,900
$264,900
Available: Right Now
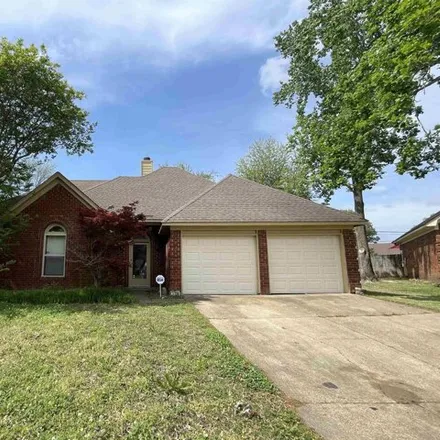
Ready for your next project? This house could use a nice facelift to bring it back to life, but the bones are great. Ideal for investors looking for their next buy and hold or homeowners willing to build some sweat equity. Will make a great investmen...
$85,000
$85,000
Available: Right Now
Investment opportunity! 2-bed, 2-bath house with long-term paying tenants. Also available as part of a 5-home package deal, all leased to a business serving the mentally challenged. All homes are on the same street next door to each other97, 103, 111...
$1,3M
$1,3M
Available: Right Now
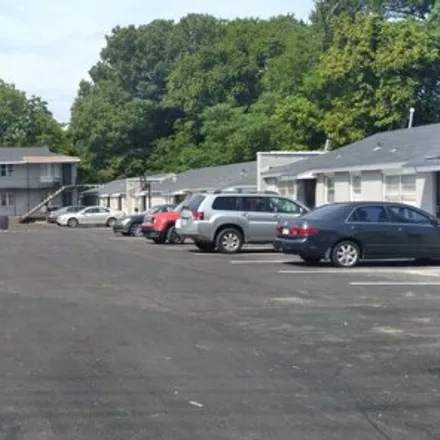
27 unit Multi-family apartment in Vollintine / Springdale area. Mix of 3 bedrooms, 2 bedrooms, and 1 bedroom units. Update July 2022: Owner has replaced sewer lines, repaired concrete walkways and stairs, welding work, and removed some trees since or...
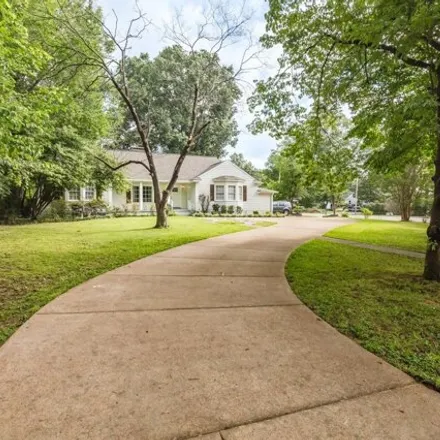
$605,000
$605,000
Available: Right Now
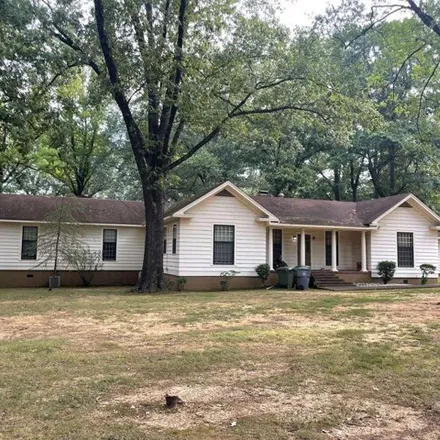
ReDevelopment Opportunity = 2.163 acres in heart of East Memphis Charming 1950s Farm House style with plenty of character and ripe for updates. Spacious rooms, large windows. All bedrooms w/ on-suite bathrooms. House needs full rehab, but would make ...
$125,000
$125,000
Available: Right Now
Investors only ! Cash offers only ! No blind offers ! Please go and see the property before submitting your offer . quadplex ! Estimated Market Rent $3200/month, $800 per unit. All units are 1 bedroom, 1 bathroom units. Pr...
$174,900
$174,900
Available: Right Now
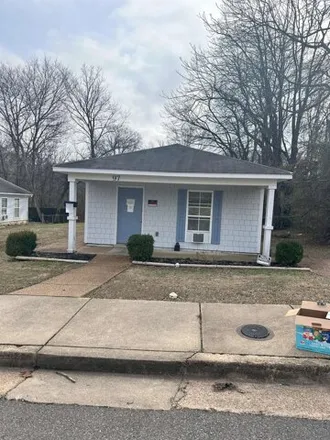
Welcome to your next Home or investment opportunity! This charming three-bedroom, two-bathroom property is a gem with a solid rental history, making it a lucrative investment for any savvy buyer. Rents@$1300. Spacious bedrooms and well-appointed bath...
$120,000
$120,000
Available: Right Now
New Listing. Spacious condo with 3 bedrooms and 2.5 baths.The great room with a fireplace and sliding doors leading to a covered back patio adds a cozy touch. Having a private suite with a balcony on the second floor is definitely a nice feature. The...
Memphis
According to statistics, the population in Memphis, TN amounts to 650,632, which shows decline 0% compared to the previous year. The median age of the city’s residents is 34. The average household income is $37,199, shifting decline -5% from the past year, and the average property value in Memphis, TN growth 5% to $103,700 throughout the year.
| Population | 650,632 |
| Median Age | 34.3 |
| Poverty Rate | 27% |
| Household Income | $37,199 |
| Number Of Employees | 290,457 |
| Median Property Value | $103,700 |
What is the Average Price of Apartments for Sale in Memphis, TN?
| Month | Median Price |
|---|---|
| Mar 2024 |
$174,652
|
| Feb 2024 |
$174,652
|
| Jan 2024 |
$174,652
|
| Dec 2023 |
$174,652
|
| Nov 2023 |
$174,088
|
| Oct 2023 |
$152,624
|
| Month | Median Price |
|---|---|
| Mar 2024 |
$351,802
|
| Feb 2024 |
$351,802
|
| Jan 2024 |
$351,802
|
| Dec 2023 |
$214,760
|
| Nov 2023 |
$232,519
|
| Oct 2023 |
$243,841
|
Household Income
The average household income in Memphis, TN declined from $39,333 to $37,199 in the past year. This data is an estimate based upon 252,517 households in Memphis, TN . The chart below presents how household income is distributed in Memphis, TN in comparison to the revenue allocation amid households nationally.
Property Value
According to data from last year, the average property value in Memphis, TN shifted from $98,700 to $103,700 throughout the year. The subsequent graph indicates the share of properties in the given price range in Memphis, TN in comparison to the median property value in the same price segment across the country. According to the data, the greatest share of Memphis, TN properties falls in the '$80,000 to $89,999' range, which is lower than the most significant median property across the country.
Rent vs. Own
Property Taxes
One of the most important aspects for property owners is the amount of property taxes. This graph shows distribution of property taxes in Memphis, TN compared to median property taxes around the country. The prevalent amount of property taxes in Memphis, TN equals $1150, which is less than the national average.