Midlothian, TX, USA apartments for sale
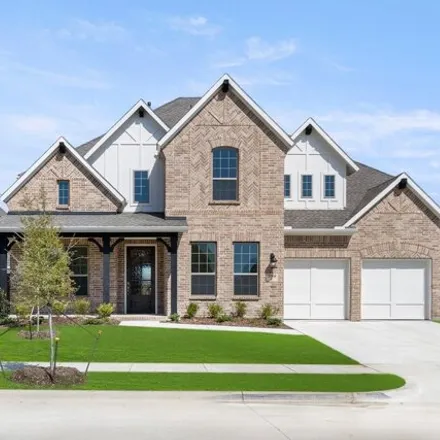
$805,454
$805,454
Available: Right Now
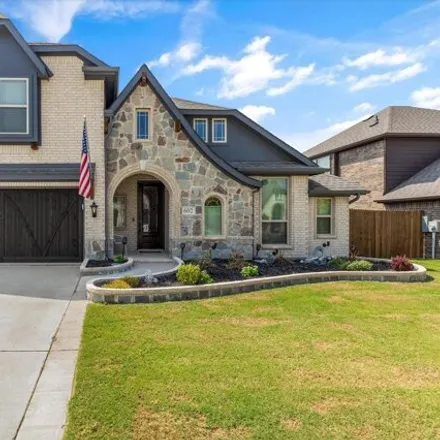
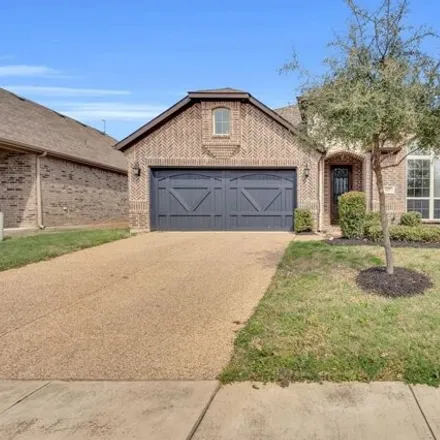
MLS# 20588719 -Built by Coventry Homes - est. const. completion Oct31, 2024 ~ Welcome to a captivating home where elegance meets functionality! This spacious five-bedroom home boasts an array of desirable features, including a dedicated game r...
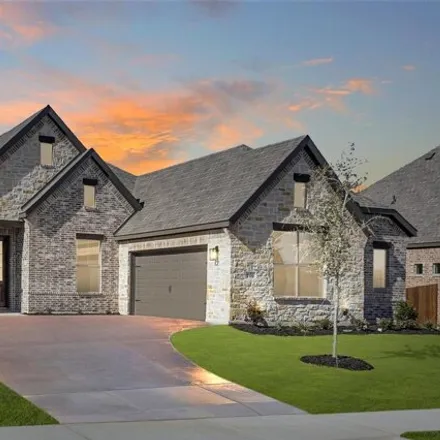
$494,932
$494,932
Available: Right Now
MLS# 20498671 -Built by Antares Homes - Ready Now! ~ Get ready to step into this stunning 3-bedroom home! With a warm and inviting atmosphere, you'll feel right at home from the get-go. Hosting guests in the formal dining room will be an absolute del...
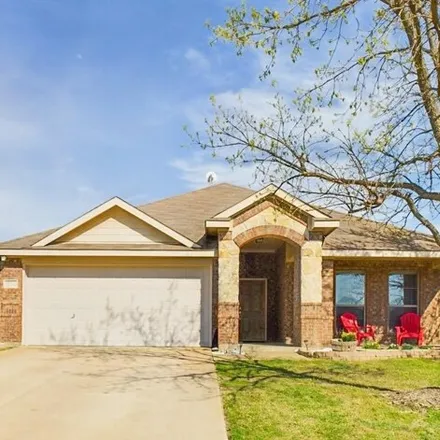
$360,000
$360,000
Available: Right Now
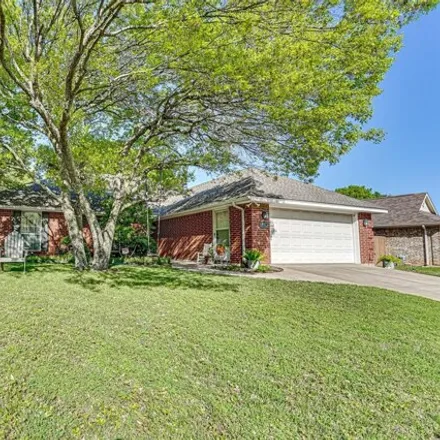
This charming 3 bdrm, 2 bth home boasts a delightful surprisea spacious game room upstairs that can double as a 4th bdrm, with a large walk-in closet! The open floor plan ensures plenty of room for relaxation and entertainment, with a family room flo...
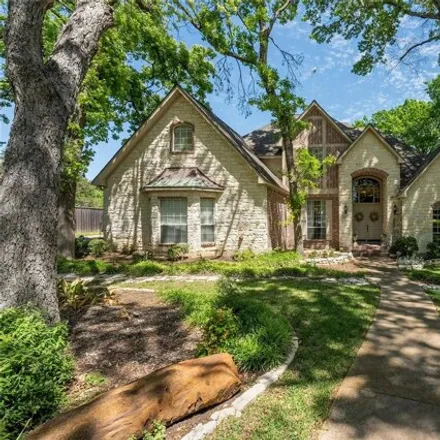
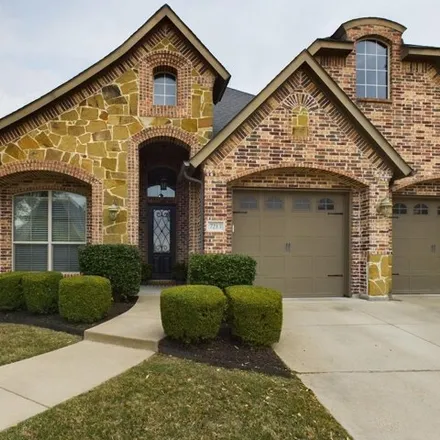
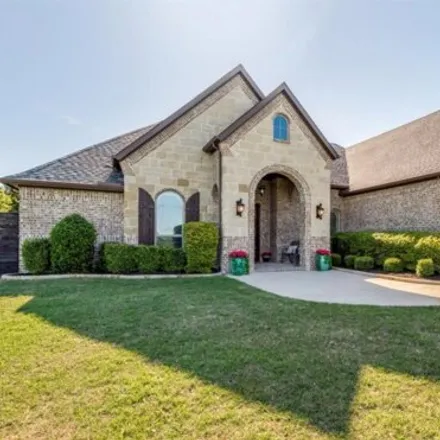
$959,900
$959,900
Available: Right Now
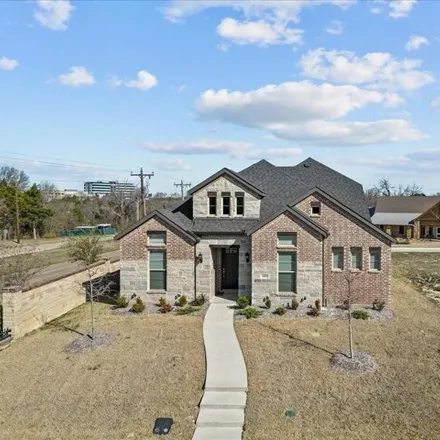
Nestled on 1.57 picturesque acres, this exquisite open floor plan is the epitome of luxury living in a true custom neighborhood. Four full bed and baths. Second suite with sitting room and private entrance. Fourth bath boasts pool access for added co...
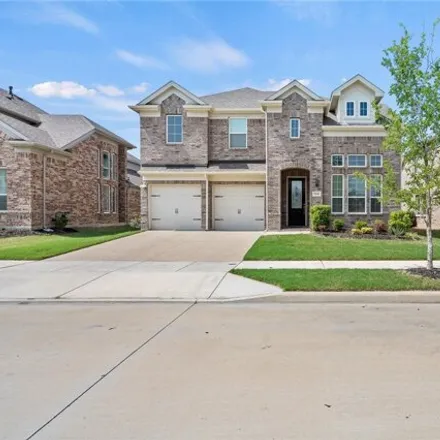
$629,000
$629,000
Available: Right Now
Call agent 2 with questions-Your new oasis awaits in Midlothians Autumn Run neighborhood. This 4 bedroom, 3 bath Bloomfield home was completed in 2022 and is in immaculate condition! Some of the many upgrades include premium luxury carpet, hand-scrap...
$509,000
$509,000
Available: Right Now
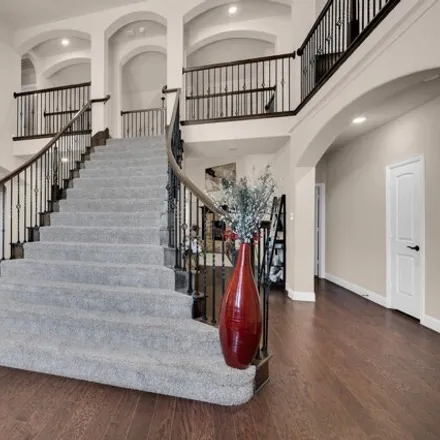
Built recently in 2022, this beautiful John Houston custom home features an open concept floor plan, tall ceilings, abundant natural light, custom cabinetry, a downstairs office, wood flooring, and much more! The primary bathroom is a major standout,...
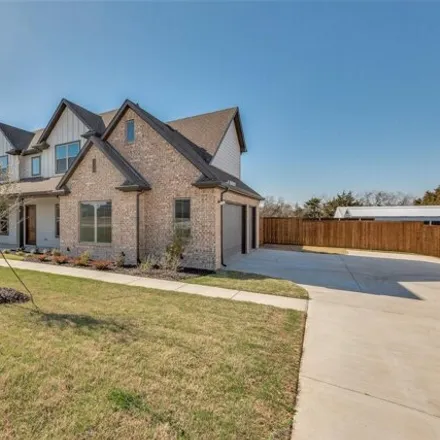
$771,900
$771,900
Available: Right Now
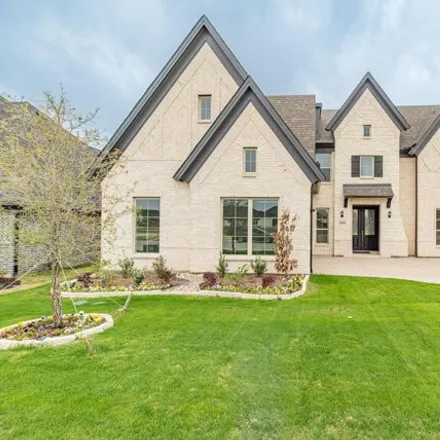
Unexpected change spells opportunity for you! Welcome to this stunning never lived in Grand Home in the gated Lakes of Somercrest community. Step inside to discover upgraded features throughout, including R3 sheathing, xtra thick LV4 padding and LV3 ...
$568,000
$568,000
Available: Right Now
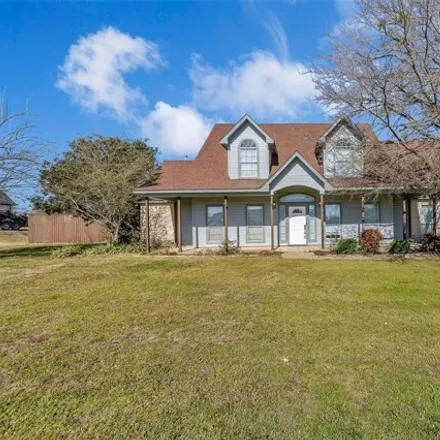
Welcome to your dream retreat nestled in the heart of Midlothian, TX! This captivating property offers the perfect blend of spacious living and serene countryside charm. Enter this expansive home, boasting with space. This large home is situated on 1...
$395,900
$395,900
Available: Right Now
Welcome to Coventry Crossing in Midlothian! Well located home with no back neighbor! Solar panels will be paid off at closing! $43, 606is the value of the solar panels that is included in the list price. How neat to have a$5-$100electricity bill in t...
$359,990
$359,990
Available: Right Now
Charming 3-3-2 in the heart of Midlothian in the desirable Midlothian Meadows! Large corner lot with established trees and beautiful yard! All new roof and gutters !!! Huge bonus, all new major mechanical replaced water heater and HVAC ...
$165,000
$165,000
Available: Right Now
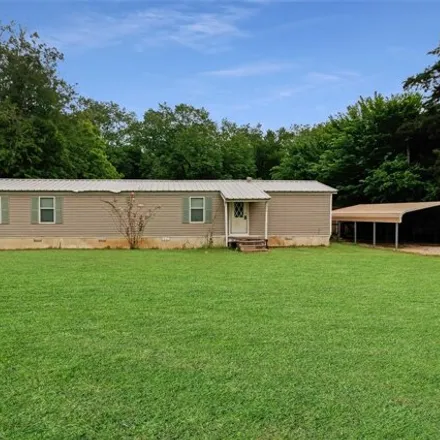
Uncover the ideal fusion of comfort and tranquility in this charming manufactured single wide mobile home nestled on a spacious.723 acre lot in the delightful town of Midlothian, TX. Boasting 2 bedrooms, 2 bathrooms, and a generous living room, this ...
$660,000
$660,000
Available: Right Now
Welcome to your dream home at 413 Frontier Court, Midlothian, TX! This stunning contemporary residence built in 2021 offers an expansive 4565 sq. ft. of luxury living space, boasting five bedrooms and five baths. Step inside and be greeted by the war...
$539,900
$539,900
Available: Right Now
Find your dream home in the gated community of texanna ranch featuring a serene atmosphere with a bridge, water feature, playground and Walking paths. noted upgrades to include iron and Glass door, hand scraped hard-wood floors, crow...
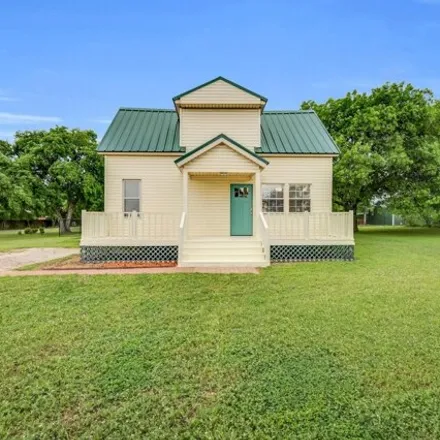
$325,000
$325,000
Available: Right Now
Welcome to your cozy oasis at4637 FM 663in Midlothian, Tx! This delightful home, brimming with character and charm, has undergone a huge transformation and is now ready to be the place that you call home. Step inside to discover a cozy interior fille...
$550,000
$550,000
Available: Right Now
Welcome home to this beautiful 4 bedroom 3.5baths, 2 car garage, home in the Prairie Ridge community. The home features an open concept with a fireplace in the living room. The kitchen features include a large granite island and plenty of storage. Fo...
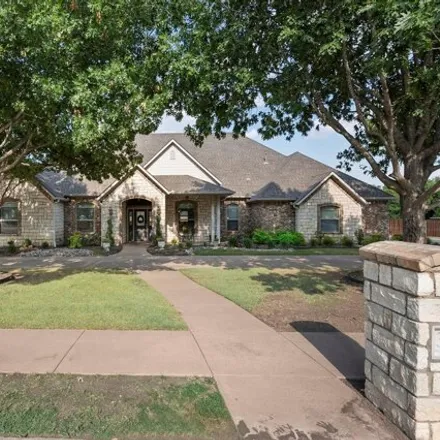
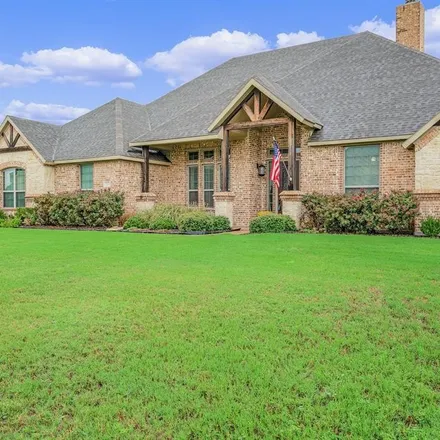
$859,900
$859,900
Available: Right Now
Meticulously maintained custom home situated on oversized corner lot and circular drive. Large family home 4 bedrooms downstairs, 4 full baths and 2 half baths, one poolside. Two living areas downstairs. Media room, hobby room, flex room and full bat...
$735,000
$735,000
Available: Right Now
Welcome to this stunning 4 bedroom, 3 bathroom home! Built in 2019, this property boasts a modern and luxurious design with a wonderful layout that is perfect for any family. As you enter the home, you'll be greeted by a study in the front, perfect f...
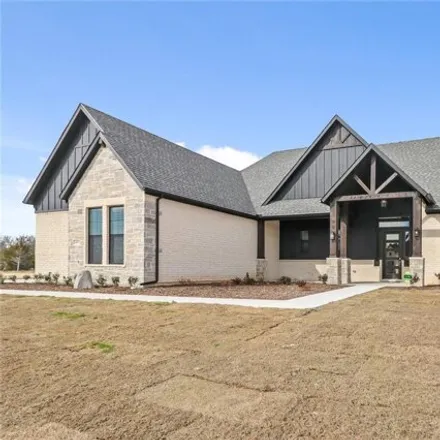
$629,990
$629,990
Available: Right Now
Welcome to The Arbors! This Meadowbrook plan built by Lillian Custom Homes features 4 bedrooms, 3.5 bathrooms, study, and 3 car garage on an acre lot. Beautiful modern farmhouse curb appeal with brick, stone, siding, bronze eaves, black window frames...
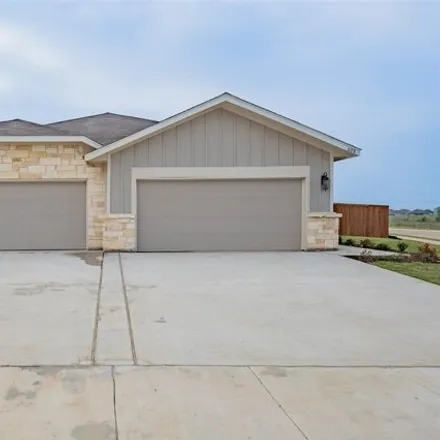
$625,000
$625,000
Available: Right Now
Prime opportunity to invest in a Class-A new construction luxury duplex in scorching hot DFW market. Builder's Preferred Lender offers below market fixed rate financing in the low to mid 5s plus get Owner's title policy paid by Builder when using pre...
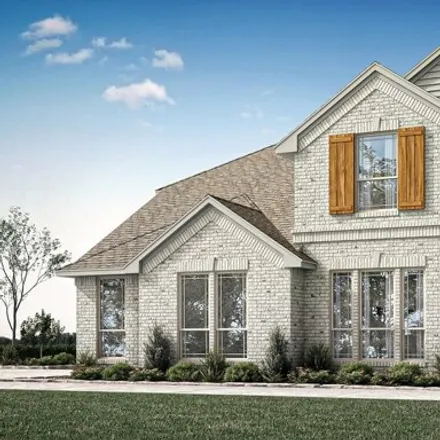
$595,000
$595,000
Available: Right Now
READY April 2024! Gorgeous Magnolia II side-entry plan from Bloomfield designed for function and flexibility. This home has tons of space for entertaining with upgraded finishes including abundant Engineered Wood floors in downstairs common areas! St...
$669,950
$669,950
Available: Right Now
Built by a longtime Lakewood and University Park custom home builder, this is not your ordinary spec home. This gorgeous custom home sits on one third of an acre, is move-in ready and offers many upgrades. Features include a gourmet kitchen with SS a...
$565,000
$565,000
Available: Right Now
Midlothian
According to statistics, the population in Midlothian, TX amounts to 22,615, which shows growth 5% compared to the previous year. The median age of the city’s residents is 34. The average household income is $76,875, shifting growth 5% from the past year, and the average property value in Midlothian, TX growth 5% to $170,800 throughout the year.
| Population | 22,615 |
| Median Age | 33.7 |
| Poverty Rate | 7% |
| Household Income | $76,875 |
| Number Of Employees | 11,213 |
| Median Property Value | $170,800 |
What is the Average Price of Apartments for Sale in Midlothian, TX?
| Month | Median Price |
|---|---|
| Mar 2024 |
$436,819
|
| Feb 2024 |
$436,819
|
| Jan 2024 |
$436,819
|
| Dec 2023 |
$436,819
|
| Nov 2023 |
$405,076
|
| Oct 2023 |
$425,974
|
| Month | Median Price |
|---|---|
| Mar 2024 |
$470,737
|
| Feb 2024 |
$470,737
|
| Jan 2024 |
$470,737
|
| Dec 2023 |
$470,737
|
| Nov 2023 |
$511,492
|
| Oct 2023 |
$543,872
|
Household Income
The average household income in Midlothian, TX grew from $72,956 to $76,875 in the past year. This data is an estimate based upon 7,473 households in Midlothian, TX . The chart below presents how household income is distributed in Midlothian, TX in comparison to the revenue allocation amid households nationally.
Property Value
According to data from last year, the average property value in Midlothian, TX shifted from $162,900 to $170,800 throughout the year. The subsequent graph indicates the share of properties in the given price range in Midlothian, TX in comparison to the median property value in the same price segment across the country. According to the data, the greatest share of Midlothian, TX properties falls in the '$150,000 to $174,999' range, which is lower than the most significant median property across the country.
Rent vs. Own
Property Taxes
One of the most important aspects for property owners is the amount of property taxes. This graph shows distribution of property taxes in Midlothian, TX compared to median property taxes around the country. The prevalent amount of property taxes in Midlothian, TX equals $3000, which is less than the national average.