Mount Vernon, WA, USA apartments for sale

$1,15M
$1,15M
Available: Right Now
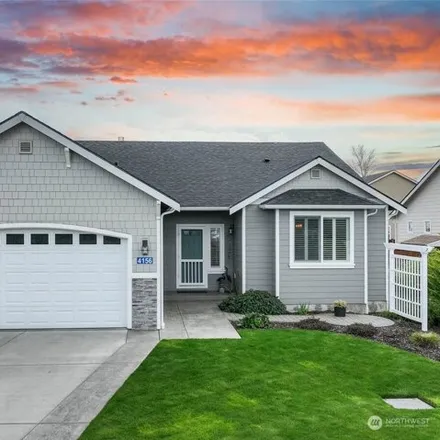
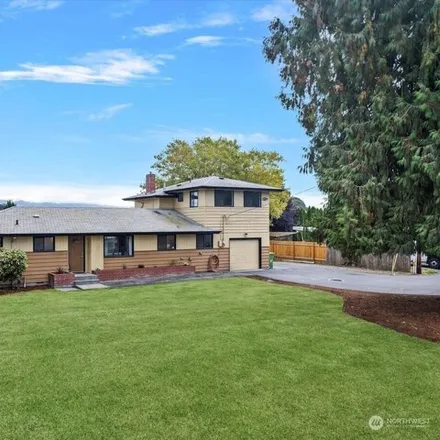
This unique layout house boasts many upgrades and features. Sitting on 1 acre lot to provide you with all outdoor dreams. Spacious family and living room, then step outside to the wrap around view deck. Primary bedroom suite on main floor with exteri...

$1,15M
$1,15M
Available: Right Now
Incredible updated home with main level living on 8.49 acres plus a massive shop for all your hobbies. This2, 002sqft home has been meticulously maintained and updated. Main level with gorgeous kitchen including Quartz countertops, custom cabinetry, ...

$824,444
$824,444
Available: Right Now
Rare incredible sound and mountain views in Mt Vernon as far as the eye can see! From the Olympic mountains, Anacortes, San Juans, all the way up to Canada. Single level home with level entry in beautiful Maddox Creek. Phenomenal and every changing s...

$1,05M
$1,05M
Available: Right Now
Enjoy rural lifestyle AND close amenities in this immaculate gated and fully fenced 5.2 acre hobby farm. House features a remodeled kitchen, wood stove, new hardwood and tile floors, sunroom entry and attached garage. The substantial2, 346sqft barn i...

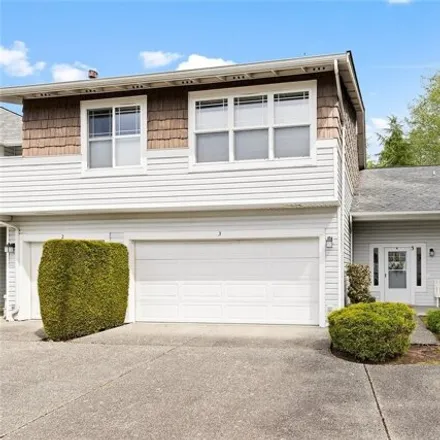
$559,000
$559,000
Available: Right Now
Welcome to your upgraded oasis, conveniently located near Kulshan trail, schools and downtown MV. This home offers 4 bedrooms, 3 full baths and has new floors, kitchen cabinets, stainless steel appliances, paint and landscaping! Upstairs you will dis...
$794,950
$794,950
Available: Right Now
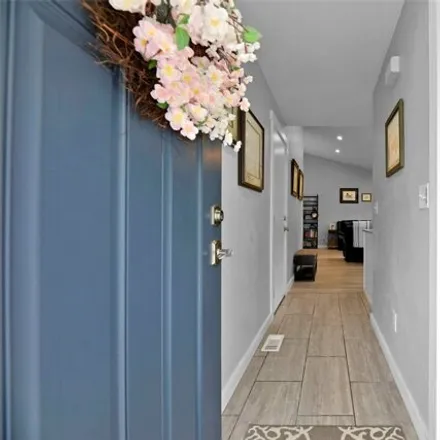
This stunning one-level home is luxury living at its best! You'll love the wide entry hall and the den/office on the right is a potential 4th bedroom. The great room showcases the beautiful fireplace and gorgeous chef's kitchen with island/bar, new S...
$795,300
$795,300
Available: Right Now
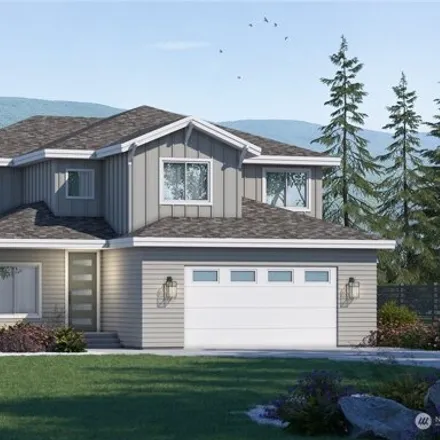
Whidbey model. Wonderful new neighborhood in Mount Vernon, close to everything. 4 bedrooms, Primary on the main floor, den with French doors (perfect for office or den), vaulted ceiling overlooking living room, walk-in pantry, quartz countertops and ...
$330,000
$330,000
Available: Right Now
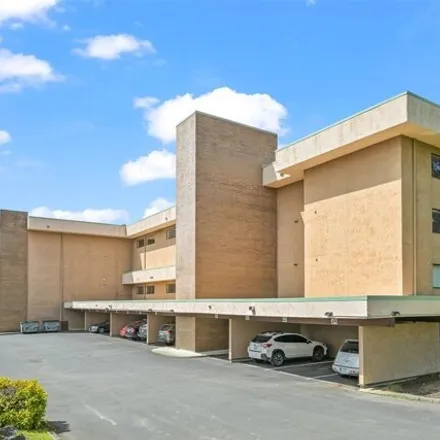
Affordable condo in Mount Vernon with beautiful territorial and mountain views! This unit has 2 bedrooms and 2 full bathrooms, a wood fireplace, a balcony, and all appliances are included. Third floor, elevator access, one covered reserved parking sp...
$699,999
$699,999
Available: Right Now
Experience luxury and carefree living in this upscale Eaglemont 3 story 3000+ sq ft condo! This END unit spans three levels but offers convenient one-level living. Freshly painted interiors with an updated kitchen complement the open living concept w...
$579,900
$579,900
Available: Right Now
Check out this beautifully maintained 4 bedroom 3 bathroom home on almost half an acre, tucked away yet close to shopping, dining and I-5. The main level features a large living room with a gas fireplace, open to the dining room, a spacious kitchen w...

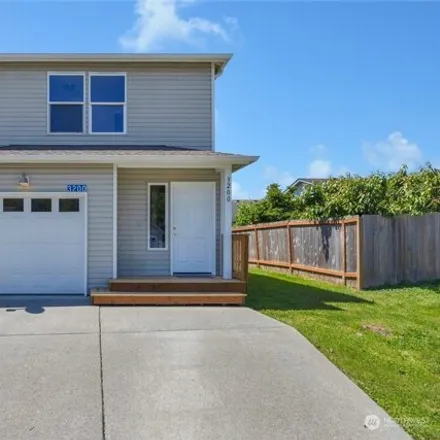
$410,000
$410,000
Available: Right Now
Built in 2020, this home has everything you could desire. Main floor has 9 ft ceilings, allowing plenty of natural light to fill the space, creating an inviting and open atmosphere. The Chef's kitchen offers expansive quartz countertop space, eat-up ...

$749,950
$749,950
Available: Right Now
Welcome to your dream home! This fully remodeled house has been meticulously updated inside and out. Featuring NEW: roof, heat pump, windows, water heater, garage doors, fresh interior and exterior paint, luxury vinyl flooring, updated bathrooms. Ele...
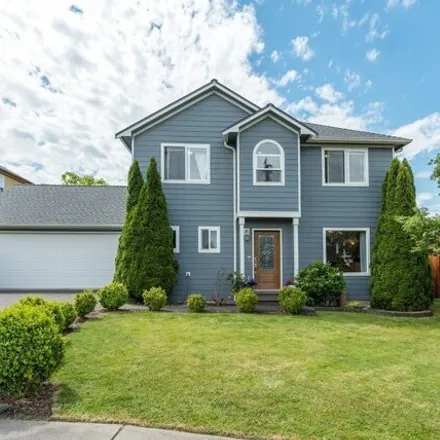
$549,900
$549,900
Available: Right Now
Better than new this move in ready home on a dead end cul-de-sac with no HOA! Located on a corner lot and tucked behind other homes, this 3 bed, 1.75 bath offers privacy and fully fenced yard. Owners have meticulously maintained the property which wa...
$979,000
$979,000
Available: Right Now
Nestled on a hillside, this stunning property offers breathtaking panoramic views of the Skagit Valley, the tranquil bay, majestic mountains, and enchanting islands. Discover the allure of cathedral ceilings accentuating the spaciousness, while a gou...
$829,000
$829,000
Available: Right Now
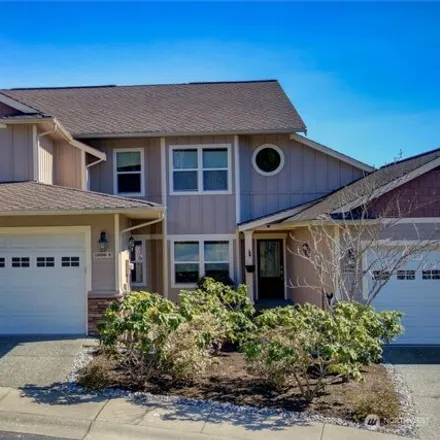
Spacious Townhome in beautiful Eaglemont Community! Primary suite on main floor/bath with jetted tub anddouble sink Open kitchen with granite and stainless steel, eating bar that opens to great room with gas fireplaceand slider to outside deck with s...

$525,000
$525,000
Available: Right Now
Escape to this cute rambler in a charming neighborhood with mountain views! Conveniently located near parks, schools, and the bus line, this home offers both serenity and accessibility. With a long private driveway leading to the property, you'll enj...
$495,000
$495,000
Available: Right Now
Fully renovated in 2020 and move in ready! Covered front patio entry leads to spacious living room w/ vaulted ceilings and large windows for lots of natural light complete w/ cozy gas f/p and slider to private rear patio w/ storage closet and greenbe...

$479,000
$479,000
Available: Right Now
Looking for a cozy 3bed 2bath rambler in an ideal location? With new carpetandLPV flooring, fresh interior paint, newer appliances, roofandgutters cleaned and moss-treated, you may move right in. Four skylights fill this spacious home w/natural light...

$1,2M
$1,2M
Available: Right Now
Outstanding rambler built by Presidio Construction, known as Dream Home 2000, which boasts stunning craftsmanship and pride of ownership. Stamped concrete circular driveway leads to portico w/ captivating beveled glass front doors. Open concep...
$499,000
$499,000
Available: Right Now
Here we have a cute 4 bedroom 2.5 bathroom home in a quiet neighborhood. Recently updated with new carpet throughout, new plumbing fixtures, appliances, and kitchen counter tops. This home offers a partially fenced yard, over 1600 square feet of livi...
$569,000
$569,000
Available: Right Now
Welcome to 1512 Sarah St! This Blackburn Ridge home has beautiful curb appeal and a back yard ready for your entertaining! Enjoy a fully fenced back yard, pergola, garden space, expansive Mahogany deck and pond/water feature. Inside features a den/of...

$560,000
$560,000
Available: Right Now
Welcome to this turnkey rambler in charming Mount Vernon! Instantly feel at home with an inviting open floor plan that flows seamlessly from the kitchen to your covered private back patio. Discover everything you desire: well-sized bedrooms, multiple...
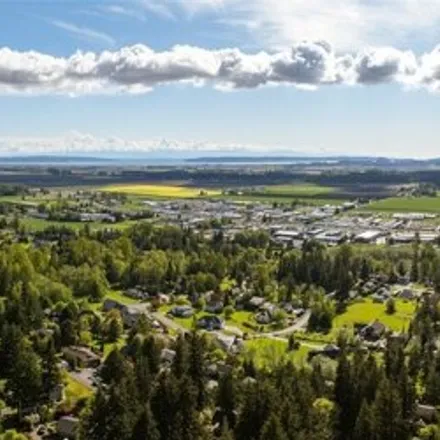
Mount Vernon
According to statistics, the population in Mount Vernon, WA amounts to 33,787, which shows growth 1% compared to the previous year. The median age of the city’s residents is 35. The average household income is $52,267, shifting growth 6% from the past year, and the average property value in Mount Vernon, WA growth 7% to $221,000 throughout the year.
| Population | 33,787 |
| Median Age | 34.7 |
| Poverty Rate | 17% |
| Household Income | $52,267 |
| Number Of Employees | 15,339 |
| Median Property Value | $221,000 |
What is the Average Price of Apartments for Sale in Mount Vernon, WA?
| Month | Median Price |
|---|---|
| Jun 2024 |
$303,227
|
| May 2024 |
$234,297
|
| Apr 2024 |
$232,426
|
| Mar 2024 |
$232,426
|
| Feb 2024 |
$232,426
|
| Jan 2024 |
$232,426
|
| Month | Median Price |
|---|---|
| Jun 2024 |
$473,357
|
| May 2024 |
$464,760
|
| Apr 2024 |
$443,239
|
| Mar 2024 |
$443,239
|
| Feb 2024 |
$443,239
|
| Jan 2024 |
$443,239
|
Household Income
The average household income in Mount Vernon, WA grew from $49,307 to $52,267 in the past year. This data is an estimate based upon 11,978 households in Mount Vernon, WA . The chart below presents how household income is distributed in Mount Vernon, WA in comparison to the revenue allocation amid households nationally.
Property Value
According to data from last year, the average property value in Mount Vernon, WA shifted from $206,500 to $221,000 throughout the year. The subsequent graph indicates the share of properties in the given price range in Mount Vernon, WA in comparison to the median property value in the same price segment across the country. According to the data, the greatest share of Mount Vernon, WA properties falls in the '$250,000 to $299,999' range, which is lower than the most significant median property across the country.
Rent vs. Own
Property Taxes
One of the most important aspects for property owners is the amount of property taxes. This graph shows distribution of property taxes in Mount Vernon, WA compared to median property taxes around the country. The prevalent amount of property taxes in Mount Vernon, WA equals $3000, which is less than the national average.