Munford, TN, USA apartments for sale

$340,000
$340,000
Available: Right Now
All I can say is perfectly perfect. Those were my words when I first walked through the door of this adorable, move-in ready home in Atoka. This home was built towards the end of 2020, so its practically brand new. A few details about this home are; ...
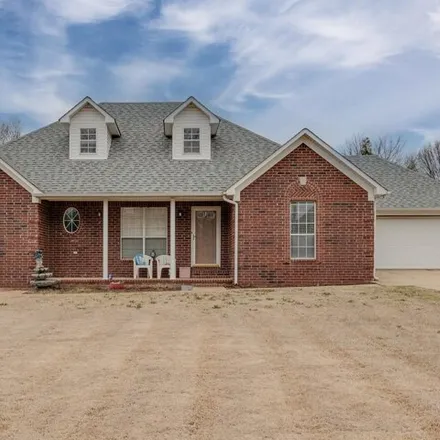
$495,000
$495,000
Available: Right Now
Relocation sale 40 min to Blue Oval! Beautiful home in Glenview Estates, no HOA and LOW Tipton County Taxes! 4BR/3BAand a dedicated office with an open-split floor plan. Enjoy the extraordinary gourmet kitchen equipped with gas range and beaut...

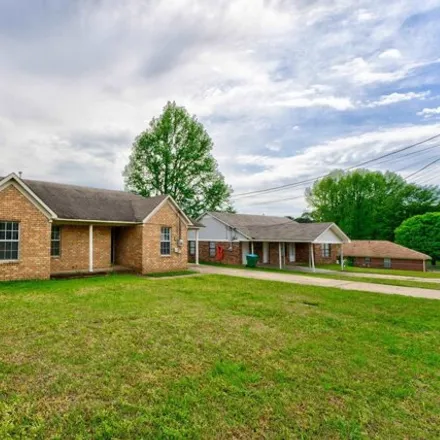
$312,000
$312,000
Available: Right Now
Brick home 4 bedroom/2 bath. open floor plan.9 ft ceilings. large primary bedroom and En-suite hosts double vanities and HUGE Walk In closet. mohawk revwood flooring. carrier hvac. moen faucets, granite countertops and backsplash in ...

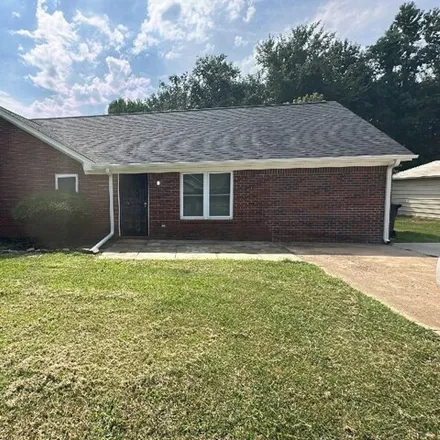
$285,000
$285,000
Available: Right Now
Turn-key 3 bed, 2 bath home in Munford, move-in ready! The primary bath features a stunning oversized walk-in shower. Enjoy cooking on the gas range in the kitchen. The fenced-in backyard offers privacy and space for outdoor activities. Located in a ...
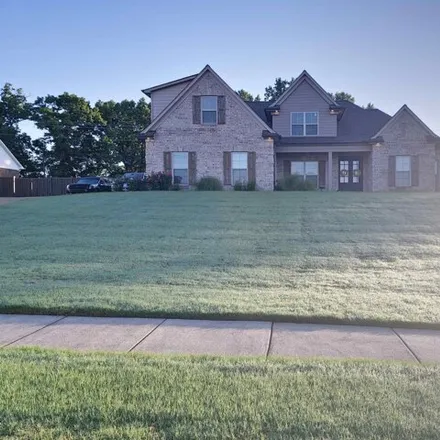
$400,000
$400,000
Available: Right Now
Low Tipton County taxes! 4BR/2BAhome w/so much to offer! Great Room w/FP; primary bed w/stunning redone bath featuring heated floors; office could be a 5th BR, playroom, nursery; split floorplan; upstairs offer a massive 4th BR or bonus room and plen...

$560,000
$560,000
Available: Right Now
Come check out this Stunning 4 Bed 3 Full Bath. Cool off in the backyard with inground pool that will beat the summer heat! Home has been renovated with fresh paint throughout. Pool equipment will stay with property. Working from home this house offe...
$225,000
$225,000
Available: Right Now
Stop throwing rent away and earn equity in this great starter home in the wonderful city of Munford. All new Hand-scraped Hardwood laminate floors, tile in both bathrooms, updated light fixtures and new hot water heater, all installed in 2021! This b...

$259,500
$259,500
Available: Right Now
Great home located on a quiet cove in Munford, close to parks and shopping. Sit on your secluded back deck and enjoy your private backyard while the kids and dog enjoy the backyard. Great kitchen with lots of cabinets, a breakfast bar and a cozy den ...
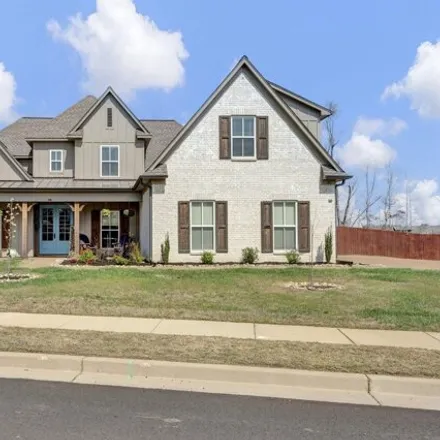
$565,000
$565,000
Available: Right Now
Looking for a newer build with character on 1.14 acres on a cove in Tipton? This is it! Fabulous floorplan with 4 bedrooms~ 3 bathrooms, a media/bonus room and an office upstairs. Did I mention the open floorplan with the kitchen/greatroom? This home...

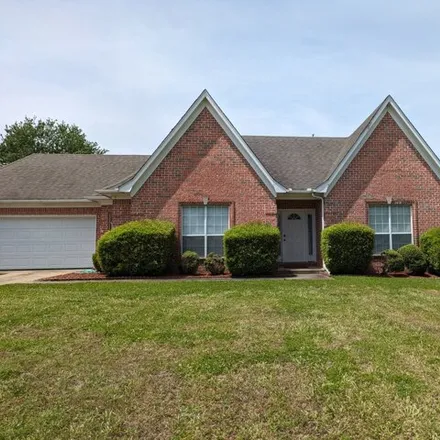
$445,900
$445,900
Available: Right Now
One step inside... and you'll say WOW! Immaculate 4 bedroom 3 bath home in Atoka TN is just what you are looking for. Perfectly situated on this corner lot, this home features bull nose corners, upgraded trim, quality cabinets and a whole lot more. E...

$345,000
$345,000
Available: Right Now
Built in 2022 by DandD Homes, this immaculate home features an open floor plan, partially ADA accessible layout, and numerous upgrades paid for by the seller. Enjoy a modern kitchen with a gas stove, island, granite counters, stainless steel applianc...

$349,000
$349,000
Available: Right Now
Well-maintained one owner home is ready for your personal touch! Split floor-plan with spacious eat-in kitchen, plus a formal dining room for family gatherings. All large bedrooms and closets. Huge laundry room with flex space. All brick exterior wit...
$249,999
$249,999
Available: Right Now
Beautifully renovated 3 Bedroom 2 bath home in South Tipton County. Near schools, shopping and restaurants. Features include granite countertops, tile flooring throughout, upgraded kitchen and bath fixtures, upgraded lighting, stainless steel applian...

$499,000
$499,000
Available: Right Now
Opportunity Knocks! Get It before Its GONE!! This Stunning 4 Bed 3.5 Bath French Country Home with.46 Acres with Salt Water In-Ground Pool with Waterfall with Custom Brick Ledge Patio. 2 Primary Bedrooms, Movie Room, Chef Kitchen with Granite Counter...
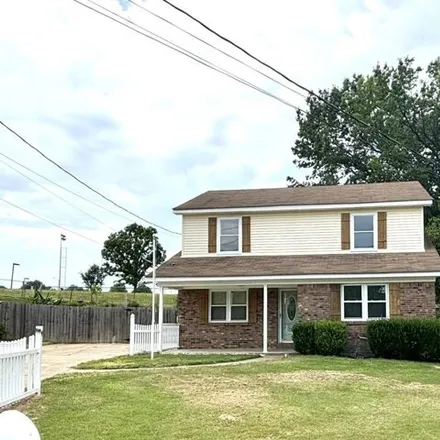
$289,000
$289,000
Available: Right Now
Newly renovated 2 story home on a quiet cove in the heart of Munford. Complete with appliances, this move-in ready home is located right around the corner from a neighborhood park and is within walking distance of Munford schools. Features include Ne...

$680,000
$680,000
Available: Right Now
This home is the best Lochmeade has to offer. It has all the bells and whistles with upgrades galore. The pool area and landscaping is magnificent. 5 BD 3bath with additional office room down w/ Bonus/Movie room up and 2 BD up and 3 BD down Great lay...
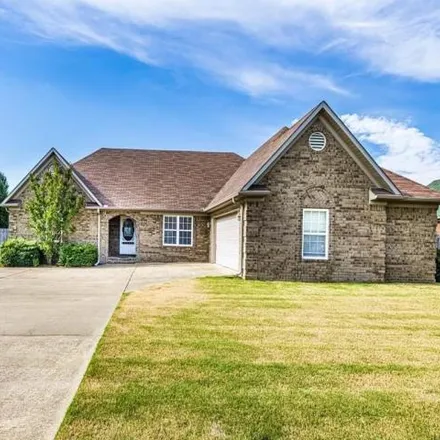
$349,000
$349,000
Available: Right Now
Fantastic home located in a very desirable Williamsburg Estates! This home features 3 spacious bedrooms plus office! Split floorplan. You will also find a formal dining room for all of those family get togethers! Expansive family room with fireplace ...
$319,900
$319,900
Available: Right Now
This is a great one story home with 9Ft high smooth ceiling and on a half acre. Updated Laminate Flooring in Living room and Dining Room. Living room with corner fireplace and French doors that open to the covered patio. Dining room has coffered ceil...

$380,000
$380,000
Available: Right Now
DandD Built-magnolia plan.. Step into a world of modern elegance with this stunning home boasting an Open-Concept with Hardwood floors that effortlessly connect the great room, kitchen, and dining area. The kitchen, features exquisite black le...

$514,900
$514,900
Available: Right Now
Introducing Hannah floorplan built by Apex! Only 2 built in the area. No cookie cutter home with this one! It's 7 years old but has been so meticulously maintained you will think it's brand new! Includes 3 spacious bedrooms and bonus room, 2 full and...

$249,900
$249,900
Available: Right Now
This property will be a fantastic addition to your rental portfolio and is also suitable for buyer-occupants. Located near jobs and commerce, it will remain in high demand with local tenants. The property is in good condition, requiring minimal repai...

$580,000
$580,000
Available: Right Now
Indulge in almost 20 acres of country like living with this expansive 4 bed, 3 bath home spanning over 3000 sq ft. Entertain in the gorgeous kitchen, gather around the cozy fireplace, and bask in the abundant natural light that illuminates every corn...
Munford
According to statistics, the population in Munford, TN amounts to 6,009, which shows decline 0% compared to the previous year. The median age of the city’s residents is 36. The average household income is $67,813, shifting growth 6% from the past year, and the average property value in Munford, TN growth 4% to $153,700 throughout the year.
| Population | 6,009 |
| Median Age | 35.6 |
| Poverty Rate | 14% |
| Household Income | $67,813 |
| Number Of Employees | 2,838 |
| Median Property Value | $153,700 |
Household Income
The average household income in Munford, TN grew from $64,226 to $67,813 in the past year. This data is an estimate based upon 2,116 households in Munford, TN . The chart below presents how household income is distributed in Munford, TN in comparison to the revenue allocation amid households nationally.
Property Value
According to data from last year, the average property value in Munford, TN shifted from $148,300 to $153,700 throughout the year. The subsequent graph indicates the share of properties in the given price range in Munford, TN in comparison to the median property value in the same price segment across the country. According to the data, the greatest share of Munford, TN properties falls in the '$100,000 to $124,999' range, which is lower than the most significant median property across the country.
Rent vs. Own
Property Taxes
One of the most important aspects for property owners is the amount of property taxes. This graph shows distribution of property taxes in Munford, TN compared to median property taxes around the country. The prevalent amount of property taxes in Munford, TN equals $1150, which is less than the national average.