New Milford, CT, USA apartments for sale

$1,2M
$1,2M
Available: Right Now
Privately set, on a near 2 acre lot, with inground pool, spa and cabana, in Sherman's premier golf community, this grand 6500+ SF plan showcases 9 ft and vaulted ceilings, Mahogany floors throughout, 4 fireplaces and more! A grand foyer with circular...
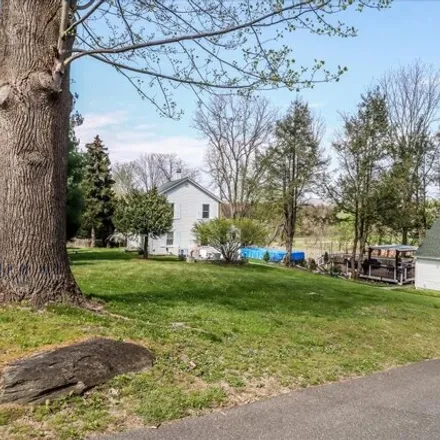
$495,000
$495,000
Available: Right Now
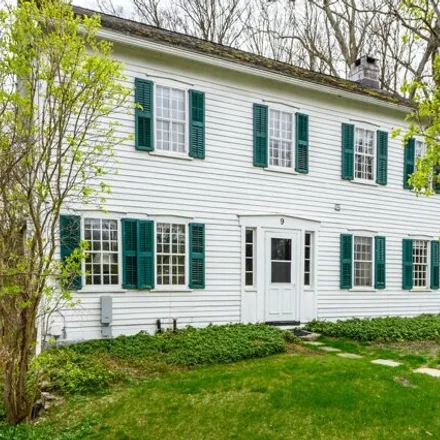
Welcome to 75 Sullivan Rd, a meticulously maintained and updated 1800's colonial home in Southern New Milford... minutes away from Brookfield shoping center, easy acces to Rt 7 and 84, this outstanding property offers all the conforts and expectation...

$1,25M
$1,25M
Available: Right Now
An ever changing, ever captivating, ever inspiring view - of distant hills, stunning sunsets, clear skies or a symphony of clouds, fog-shrouded mountains or a glorious moon - fills every room. Whether you're at the kitchen island, dining, relaxing in...

$589,900
$589,900
Available: Right Now
Welcome to Candlewood Echoes, You will exhale the minute you enter the property. Relax on the beach, kayak, paddle board, swim to your heart's content, or go out on a twilight boat ride. This is the way life should be! One level living at its best, c...

$400,000
$400,000
Available: Right Now
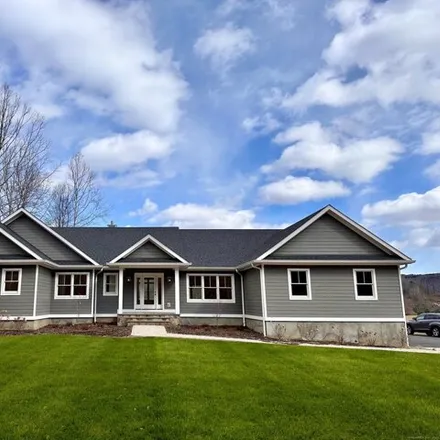
Welcome home! This charming and well maintained Ranch is ideally situated within walking distance to the picturesque New Milford Green. This delightful property offers a blend of comfort and convenience, featuring 3 inviting bedrooms and 1.5 baths. T...

$409,000
$409,000
Available: Right Now
Modern Elegance! 1-2 Bedroom/2 full bath home! The large dining room features stunning hardwood flooring, a double-sided fireplace, and a sunny bay window, an ideal backdrop for unforgettable gatherings. The kitchen boasts new appliances, including a...
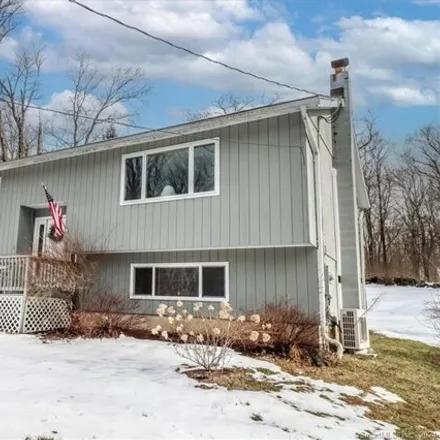
$589,900
$589,900
Available: Right Now
Updated, Well Maintained, 3 Bedroom Raised Ranch in Desirable Deer Run Shores Community. Many Updates in last ten years: Kitchen, Stainless Whirlpool Appliances, Baths, Windows, Roof, Driveway, Hot Water Heater, Well Tank, Carpets, Lighting, Electric...

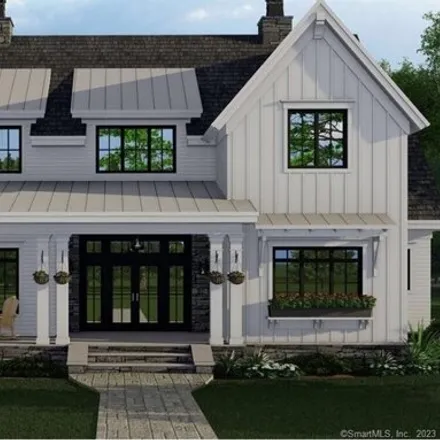
$1,35M
$1,35M
Available: Right Now
Welcome to your dream home! This custom-built masterpiece has it all, starting with a dramatic two-story entry that sets the tone for this impeccably maintained residence. Throughout, you'll find beautiful hardwood floors, exquisite custom woodwork a...

$699,000
$699,000
Available: Right Now
A truly fantastic and special home located between the Marina and Dike Point Park overlooking Candlewood Lake. House is completely remodeled with not a detail missed. All new insulation, mechanics, central air system, windows, metal roof, composite d...

$749,000
$749,000
Available: Right Now
This handsome Tudor-style home on a beautiful level acre of land is less than a 10 minute drive to Brookfield Town Beach on Candlewood Lake and only 7 minutes from Old Bridge Park on the banks of the Housatonic River! The property has so many special...

$539,000
$539,000
Available: Right Now
Southern New Milford opportunity!....Home well maintained- generous size rooms, beautiful fire place with stone veneer...this colonial offers easy commute to RT7 and I84, lots of privacy and still a lot of potential - New heating unit, granite tops, ...

$300,000
$300,000
Available: Right Now
This picturesque property has direct waterfront access on the Housatonic River. Located on one of Connecticut's scenic roads, this 1 Bedroom, 1 Bath cottage, on.37 acres has a Remodeled Bathroom with Marble Tile Floor, Beautiful Wrap Around Deck, and...
$1,6M
$1,6M
Available: Right Now
Welcome to The Club at River Oaks in beautiful Sherman Connecticut. Wonderful golf course lot. Beautiful 5 bedroom custom home. Hardwood floors through out. Gourmet kitchen with granite counter tops. Deck overlooking the golf course. Social membershi...

$425,000
$425,000
Available: Right Now
IN-TOWNAntique Cape on the Sawmill Brook in the heart of Small town usa ! A wonderful location for anyone that wants to beIN-TOWNbut not on the main road. Across from Sherman Library and a short stroll down to community Veterans Park, jogging ...
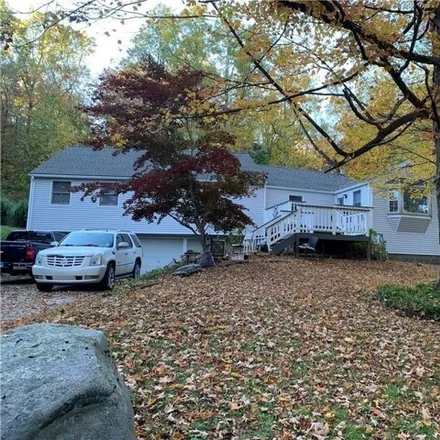
$459,000
$459,000
Available: Right Now
Come see a very private ranch home, nestled away with a very private patio with swimming, pool and fire pit. close to all amenities. Only 6.4 miles away from Harlem Valley Wingdale train station and only minutes away from downtown New Milford , Sherm...

$455,000
$455,000
Available: Right Now
Great opportunity to owe this home!!! Gorgeous home situated on a dead end street. This charming home offers hardwood flooring throughout and a functional main level layout. There is an updated kitchen with granite countertops and a nice fireplace of...

$59,900
$59,900
Available: Right Now
7 Duncan Lane. Small, yet intimate and cozy, comfortable living - a perfect condo alternative. 3 bedroom home in a country setting. Home is currently being used as a 2-bedroom. Main bedroom has an attached half bath. Open floor plan with a spacious k...
$1,45M
$1,45M
Available: Right Now
Surrounded by breathtaking panoramic views, this newley home offers the ultimate retreat for golf enthusiasts. This single-level residence in the prestigious community of Club River Oaks boasts a variety of amenities tailored to enhance your experien...
$550,000
$550,000
Available: Right Now
This colonial home, built in 1824, exudes timeless elegance with its wide-board wood flooring, classic paneling, and not one but two charming fireplaces. The expansive walk-up attic adds to its allure, offering ample space for storage or potential ex...

$355,000
$355,000
Available: Right Now
Location, location, location! Welcome to Millstone Ridge, a Candlewood Lake community. In less than a minute drive or few minute walk, you will arrive at the shores of Candlewood Lake, the community's private beach and boat launch. No monthly HOA fee...

$549,000
$549,000
Available: Right Now
Unique opportunity to acquire a mixed-use property with endless possibilities in the heart of historic Gaylordsville. Built in 1911, formerly the Wemanesa Grange Hall, this expansive4, 500 SFbuilding includes a huge fenced-in backyard. Currently the ...

$209,900
$209,900
Available: Right Now
Opportunity awaits at one of New Milford's premier condominium complexes! Immediate occupancy is available for the next savvy owner occupant or investor. Enjoy your summer days cooling off in the pristine pool, and spend cozy winter nights by the inv...
New Milford
According to statistics, the population in New Milford, CT amounts to 7,073, which shows decline 0% compared to the previous year. The median age of the city’s residents is 41. The average household income is $57,768, shifting growth 1% from the past year, and the average property value in New Milford, CT decline -2% to $220,700 throughout the year.
| Population | 7,073 |
| Median Age | 40.8 |
| Poverty Rate | 11% |
| Household Income | $57,768 |
| Number Of Employees | 4,208 |
| Median Property Value | $220,700 |
What is the Average Price of Apartments for Sale in New Milford, CT?
| Month | Median Price |
|---|---|
| Jun 2024 |
$656,983
|
| May 2024 |
$651,636
|
| Apr 2024 |
$536,593
|
| Mar 2024 |
$536,593
|
| Feb 2024 |
$536,593
|
| Jan 2024 |
$536,593
|
| Month | Median Price |
|---|---|
| Jun 2024 |
$635,036
|
| May 2024 |
$615,309
|
| Apr 2024 |
$614,851
|
| Mar 2024 |
$614,851
|
| Feb 2024 |
$614,851
|
| Jan 2024 |
$614,851
|
Household Income
The average household income in New Milford, CT grew from $57,108 to $57,768 in the past year. This data is an estimate based upon 3,041 households in New Milford, CT . The chart below presents how household income is distributed in New Milford, CT in comparison to the revenue allocation amid households nationally.
Property Value
According to data from last year, the average property value in New Milford, CT shifted from $224,700 to $220,700 throughout the year. The subsequent graph indicates the share of properties in the given price range in New Milford, CT in comparison to the median property value in the same price segment across the country. According to the data, the greatest share of New Milford, CT properties falls in the '$200,000 to $249,999' range, which is lower than the most significant median property across the country.
Rent vs. Own
Property Taxes
One of the most important aspects for property owners is the amount of property taxes. This graph shows distribution of property taxes in New Milford, CT compared to median property taxes around the country. The prevalent amount of property taxes in New Milford, CT equals $3000, which is less than the national average.