Normal, IL, USA apartments for sale
$475,000
$475,000
Available: Right Now
Pheasant Ridge Welcomes The Conlor 3.0 Plan! You'll enjoy the open kitchen with walk in panty and center island to entertain which opens to a nice size living room featuring a gas fireplace with beautiful stone/tile surround and a sharp mantle. The f...

$979,000
$979,000
Available: Right Now
Wow, this home in Trails at Sunset is an absolute dream! The perfect home for a large family or entertaining guests, with 6 bedrooms, 5.5 baths, 12ft ceilings, and an open floor plan. The main floor features beautiful scraped hardwood floors, a spaci...
$385,000
$385,000
Available: Right Now
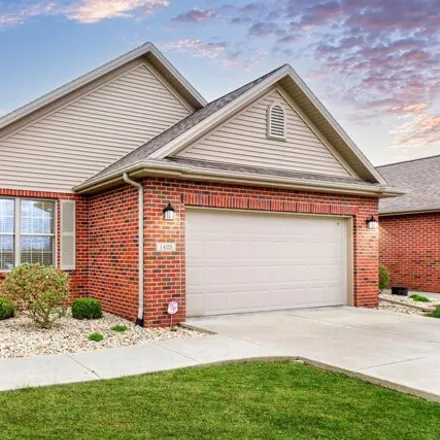
Welcome to 1425 Pine Forest Dr, where luxury living meets effortless comfort in Normal, IL. This exquisite home has undergone a complete transformation, boasting refined finishes and thoughtful upgrades throughout. Step inside to discover new Maple e...
$349,999
$349,999
Available: Right Now
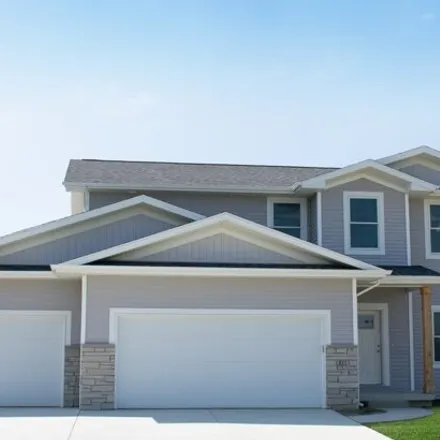
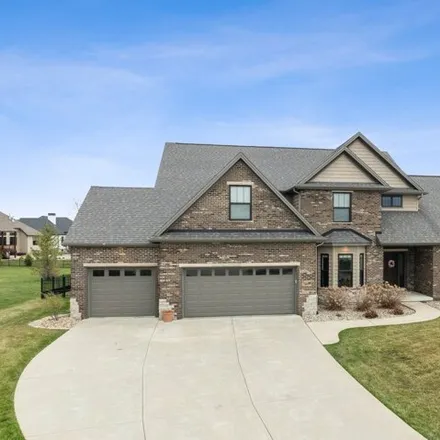
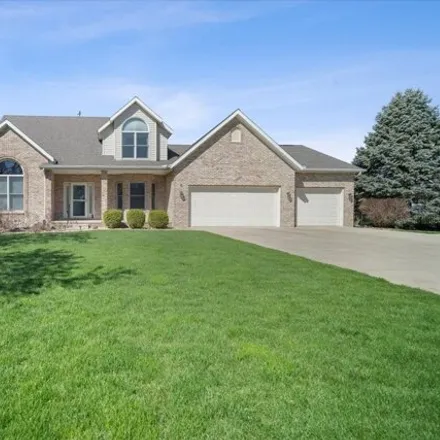
Fantastic location !! 2 of the 4 bedrooms have walk-in closets. Master bedroom is located on the 1st floor, and the other 3 bedrooms are located on the 2nd floor. Part of the basement is finished and ready for whatever you desire it to be. The...
$165,000
$165,000
Available: Right Now
$145,000
$145,000
Available: Right Now
$167,000
$167,000
Available: Right Now
$885,000
$885,000
Available: Right Now
Welcome to this waterfront brick ranch! Imagine waking up to the serene views while sipping coffee from your large covered back deck. The kitchen is a chef's dream with its gorgeous cabinets, dual islands, and cool pendant lighting - perfect for host...

$133,000
$133,000
Available: Right Now
Nice home looking for a new owner, Currently has a tenant that has lived there since 2003. No inside pics per tenant. Tenant would stay if new owner wants to rent. Detached garage, home is a couple blocks from Stevenson grade school and their playgro...
$169,900
$169,900
Available: Right Now
$839,900
$839,900
Available: Right Now
Welcome to Trails at Sunset!!! This custom built Trunk Bay home was designed to the clients exact specification. The home features 3 primary suites strategically incorporated throughout the home. Whether you have parent(s), in-laws or host guests...t...
$275,000
$275,000
Available: Right Now
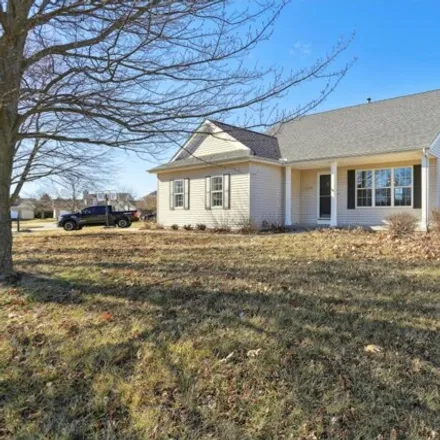
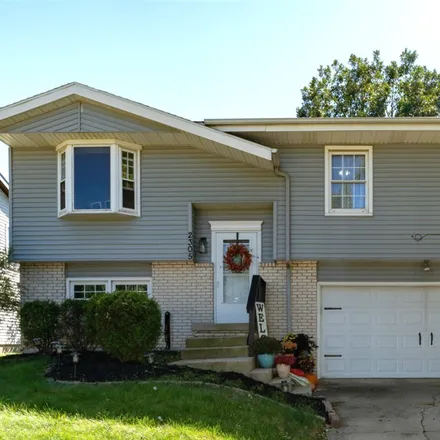
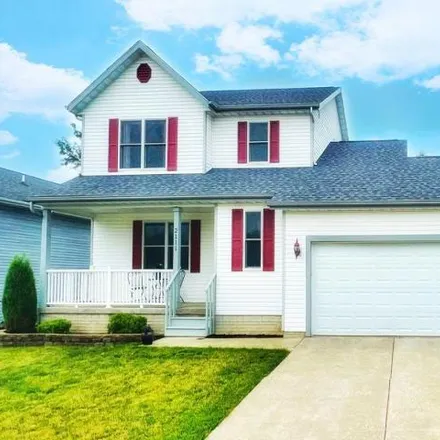
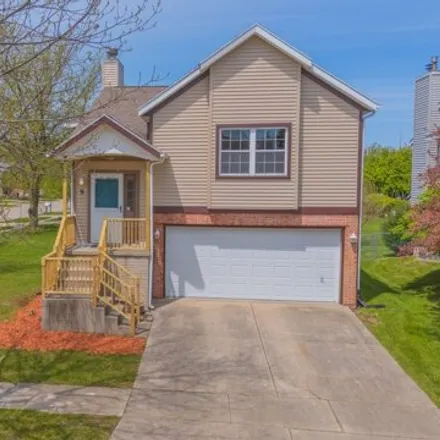
Introducing this simply lovely traditional two-story in North Normal! Full roof replacement in2021, ACUnit in 2019 and a new Water Heater in 2021 add to the low maintenance living of this well-planned home. Modern open concept main floor features tid...
$189,500
$189,500
Available: Right Now
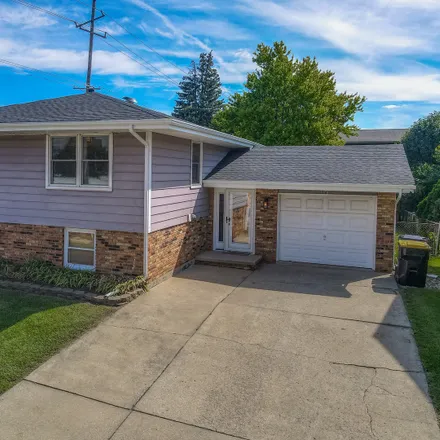
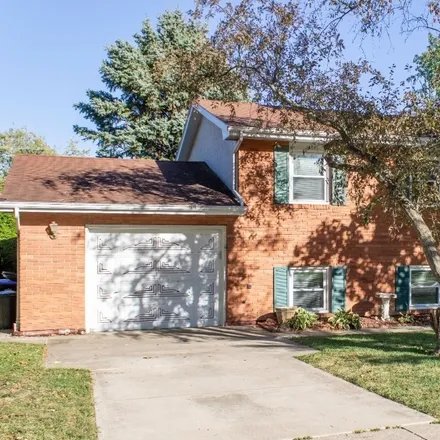
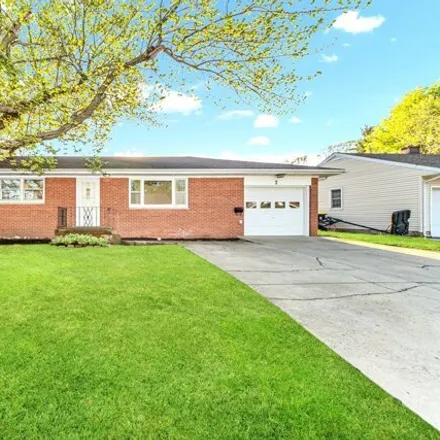
More for the money with this charming, brick, ranch style home with full, finished basement! Don't miss this spacious home with the main level consisting of a living room, kitchen with dining area, full bathroom, three bedrooms (all with hardw...
$415,000
$415,000
Available: Right Now
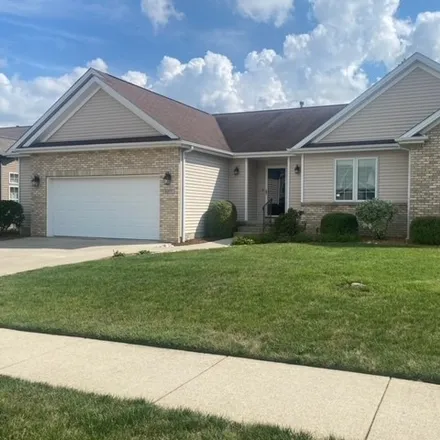
Fantastic ranch on a great corner lot in Blackstone Trails! Fantastic and fresh open floor plan with lots of natural light. This house is better than new with window coverings and all appliances remaining. Large finished family room in the basement w...
$299,900
$299,900
Available: Right Now
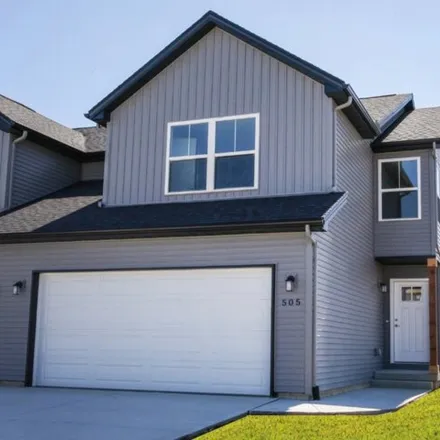
Wonderful new townhouse floorplan out in Pheasant Ridge. Enjoy spacious living area on main floor with kitchen featuring abundant countertop and cabinet space. Hardwood/LVP floors also run thru main level giving a super sharp look. Upstairs has 3 rea...
$355,000
$355,000
Available: Right Now
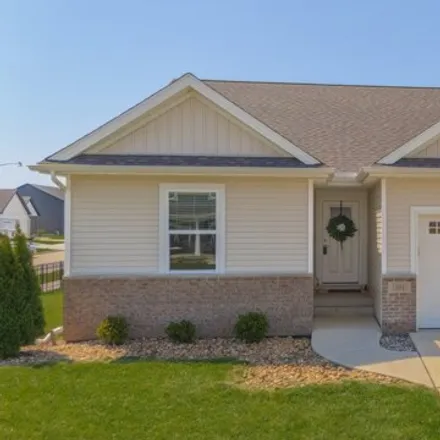
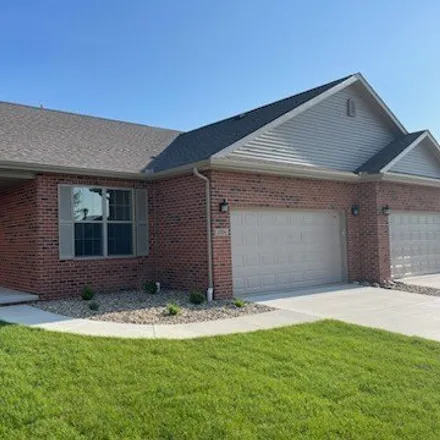
New construction in a lovely community with lawn care and snow removal provided. Well designed floor plan with quality construction. 9 foot ceilings. Kitchen has quartz countertops and white Merillat cabinets. Low maintenance flooring of luxury vinyl...
$380,000
$380,000
Available: Right Now
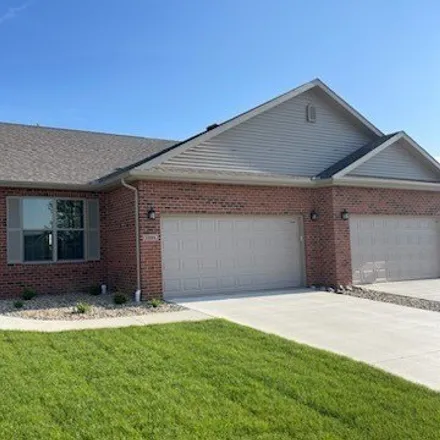
Motivated Seller! New construction in a great community. Snow Removal and Lawn Care provided by homeowner's association. Well designed floor plan. Quality construction. Merrillat kitchen cabinets including large panty. Low maintenance luxury vinyl pl...
$320,000
$320,000
Available: Right Now
$525,000
$525,000
Available: Right Now
Custom built for owners by Harrison Homes. First home built on this cul-de-sac in Hawthorne Hills. No pets, children or smoking - this home shows like new! Central vacuum, security system and back up sump pump. 4 bedrooms, 3 full and 2 half baths. Ma...
$199,900
$199,900
Available: Right Now
3 Bedroom, 2 Full bath home in Park Place, close to the Lake at White Oak Park! Living room has a cathedral ceiling and wood burning fireplace. Kitchen is open to the living room w/ stainless appliances. Brand new LVP flooring installed in4/2024in li...
$430,000
$430,000
Available: Right Now
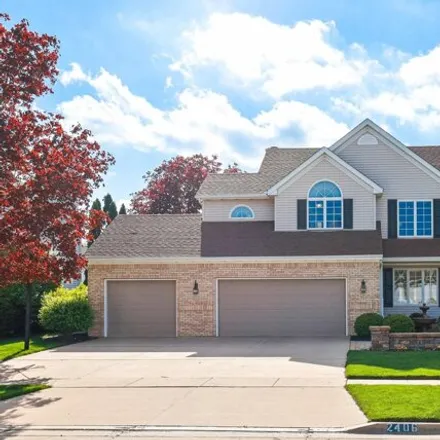
WOW! This one is incredible inside and out. Amazing landscaping and paver patios and walls in the front and back add to the beauty and enjoyment of this property. This custom floor plan has areas with 12'-16' foot ceilings and wonderful light from th...
$389,000
$389,000
Available: Right Now
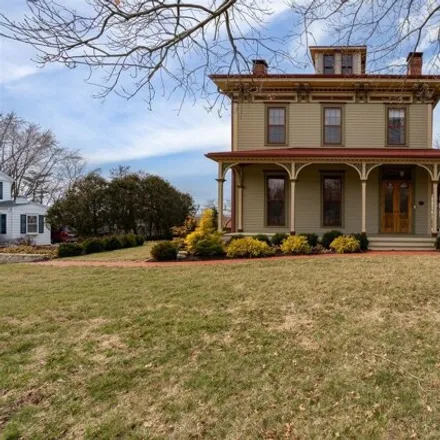
Welcome to the historic John Gregory house, a true masterpiece nestled on nearly a one-acre lot in Normal. This iconic home is a testament to meticulous restoration efforts, earning accolades as the oldest and most scrupulous piece of architectural r...
Normal
According to statistics, the population in Normal, IL amounts to 54,531, which shows decline 0% compared to the previous year. The median age of the city’s residents is 24. The average household income is $56,363, shifting growth 3% from the past year, and the average property value in Normal, IL growth 1% to $165,400 throughout the year.
| Population | 54,531 |
| Median Age | 24.4 |
| Poverty Rate | 23% |
| Household Income | $56,363 |
| Number Of Employees | 29,551 |
| Median Property Value | $165,400 |
Household Income
The average household income in Normal, IL grew from $54,496 to $56,363 in the past year. This data is an estimate based upon 19,359 households in Normal, IL . The chart below presents how household income is distributed in Normal, IL in comparison to the revenue allocation amid households nationally.
Property Value
According to data from last year, the average property value in Normal, IL shifted from $163,100 to $165,400 throughout the year. The subsequent graph indicates the share of properties in the given price range in Normal, IL in comparison to the median property value in the same price segment across the country. According to the data, the greatest share of Normal, IL properties falls in the '$150,000 to $174,999' range, which is lower than the most significant median property across the country.
Rent vs. Own
Property Taxes
One of the most important aspects for property owners is the amount of property taxes. This graph shows distribution of property taxes in Normal, IL compared to median property taxes around the country. The prevalent amount of property taxes in Normal, IL equals $3000, which is less than the national average.