North Charleston, SC, USA apartments for sale
$380,000
$380,000
Available: Right Now
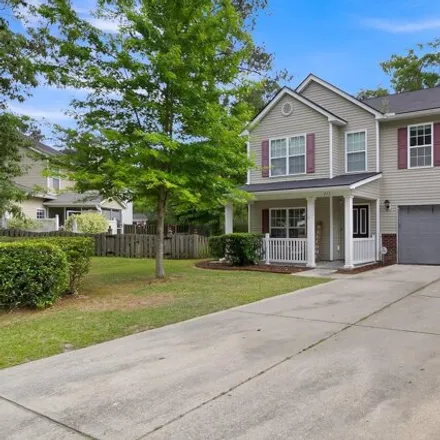
Welcome to your dream home nestled in the serene Summer Park subdivision of Ladson! This spacious 4-bedroom, 2.5-bathroom residence offers the perfect blend of comfort, privacy, and modern amenities. As you approach, you'll be greeted by the tranquil...

$453,000
$453,000
Available: Right Now
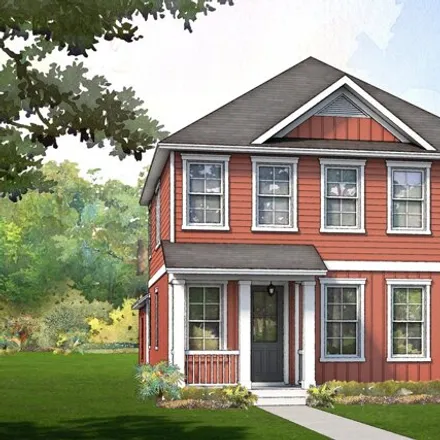
This beautiful Ryland Home is waiting for you! The Virginian floor plan boasts 3070 square foot of living space. Upon entering the front door you will find a private office to your right and a formal dining room to your left with perfect flow into th...

$465,000
$465,000
Available: Right Now
This charming ranch sits on a 1/2 ac. lot with beautiful trees and plenty of room for outdoor entertaining. A patio, fire pit and a deck waiting to be enjoyed. The kitchen was updated with gas oven and cook top and beautiful Soap Stone counter tops. ...

$359,000
$359,000
Available: Right Now
Renovated spacious home in a great location. Close to everything! Upgrades include refinished hardwood floors, new cabinets and granite counter tops. New bathrooms with upgraded tile, plumbing and vanities. The home has a garage with storage and spac...

$480,000
$480,000
Available: Right Now
Welcome to your dream home in the heart of Shadowmoss Plantation! This delightful house has everything you've been looking for-comfort, style, and a fantastic location in a popular golf course community. 5 Packard Ct is waiting for you to call it hom...
$459,900
$459,900
Available: Right Now
Brand-new home in an established neighborhood in the sought after Archdale neighborhood in Dorchester 2 school district. This spacious home comes with a two-car garage. The 4th bedroom on the 1st floor is a perfect space for an office or guest...
$195,000
$195,000
Available: Right Now
Charming 2-Bedroom Condo in North Charleston's Premier Gated CommunityWelcome to your new home in The Park at Rivers Edge! This delightful 2-bedroom, 2-bathroom first-floor condo is situated in a highly sought-after gated community in North Charlesto...

$440,000
$440,000
Available: Right Now
Welcome to your dream home nestled in the prestigious Lake Palmetto Subdivision. This stunning 3-bedroom, 3.5-bathroom townhome offers unparalleled lake-front views from all three of its outdoor balconies, providing a serene and picturesque backdrop ...

$465,000
$465,000
Available: Right Now
Welcome to your dream home! This stunning Taylor Nextgen home is less than 3 years old and is the perfect blend of modern luxury and natural serenity. Located in a peaceful neighborhood, this property backs up to the lush woods, ensuring privacy and ...

$278,000
$278,000
Available: Right Now
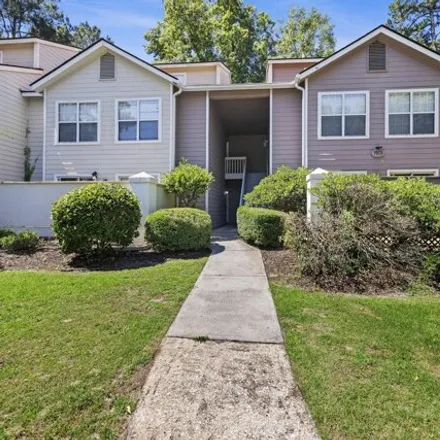
Charming 2-Bedroom Townhouse in North Charleston Welcome to 8385 Spring Farm Gate Circle, a beautifully updated 2-bedroom, 2.5-bathroom townhouse in the desirable Summers Bend on the Ashley community. This1, 450sq ft home features a renovated kitchen...

$242,500
$242,500
Available: Right Now
Owner will pay 6 months of hoa fees with full price offer. This beautiful and charming townhome is nestled in the well-maintained Oak Bluff community. Located within close proximity of the Pool and other community amenities. As you enter, be g...

$387,000
$387,000
Available: Right Now
This 4 bedroom 2 bath corner lot Home sits on almost 1/2 acre with no HOA. It is is convenient to shopping and downtown Summerville. The Owner's suite is located downstairs with a nice size kitchen and brick fireplace in the family room. You have 2 b...

$375,000
$375,000
Available: Right Now
Nestled in the serene neighborhood of Tranquil Acres, this splendid home boasts a robust foundation and resides in a prestigious area with no HOA. Spread across nearly half an acre, the property blends charm with ample outdoor space, including a lovi...
$420,000
$420,000
Available: Right Now
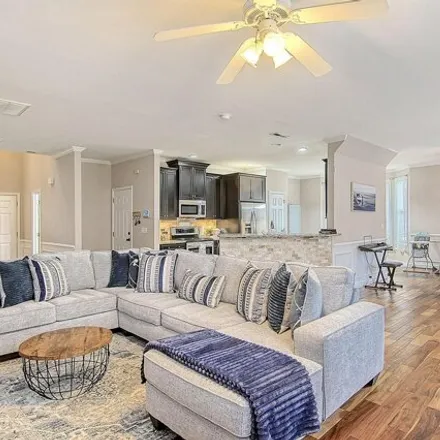
Welcome to this charming home located in Wescott Plantation. This Four bedroom home has a lot to offer with its desirable floor plan. The family room features wood floors, and a gas fireplace. The kitchen has stainless steel LG appliances, plenty of ...

$235,000
$235,000
Available: Right Now
Welcome to this exquisite turn-key 2 bedroom, 2 bathroom condo, meticulously renovated and awaiting its new owner. Step into luxury with newly installed LVP floors and plush carpeting, perfectly complemented by a brand new Frigidaire refrigerator, di...
$515,000
$515,000
Available: Right Now
Ensconced in mature landscaping that includes oak trees, this three-bedroom, two-bathroom home provides a perfect spot for respite. Upon entry, the home's soaring ceilings emphasize its open floor plan and create a spacious area. The wood-burning fir...

$379,900
$379,900
Available: Right Now
Look at this !!!!!!! This stately and spacious 2 story home is gently and conveniently nestled in Paddock Pointe. Looking for Comfort and elbow room in a pleasant and peaceful neighborhood....at an Excellent price...... look no f...

$302,500
$302,500
Available: Right Now
Welcome to Lowcountry Living at its finest! Summer's Bend on the Ashley is situated on the banks of the beautiful Ashley River and is touted as one of Charleston's 'best kept secrets.' These high-end luxury units feature Craftsman style construction,...
$205,000
$205,000
Available: Right Now
Enjoy comfort and convenience with this delightful 2-bedroom condo in Otranto Station! This move-in-ready home features new flooring throughout, fresh paint offering a blank canvas for your design dreams, and spacious living areas with natural light ...

$305,000
$305,000
Available: Right Now
Welcome home! This adorable brick ranch is so inviting and is filled with recent improvements including throughout. The family room anchors the home and is filled with lots of natural light from the bay window. Next to the dining room the updated kit...

$225,000
$225,000
Available: Right Now
Welcome to your charming new home in West Ashley! This first-floor condo offers the perfect blend of comfort and convenience. Step inside to discover 908 square feet of well-designed space featuring laminate flooring throughout.The living area is bri...

$425,000
$425,000
Available: Right Now
This beautiful 4 bedroom, 2.5 bathroom residence is nestled on a spacious lot in the desirable Woodlands at Wescott neighborhood, offers both tranquility and convenience. A privacy fence surrounds the property, complemented by a screened porch, stora...
North Charleston
According to statistics, the population in North Charleston, SC amounts to 108,186, which shows growth 2% compared to the previous year. The median age of the city’s residents is 33. The average household income is $39,944, shifting decline 1% from the past year, and the average property value in North Charleston, SC growth 8% to $155,900 throughout the year.
| Population | 108,186 |
| Median Age | 32.5 |
| Poverty Rate | 23% |
| Household Income | $39,944 |
| Number Of Employees | 50,403 |
| Median Property Value | $155,900 |
What is the Average Price of Apartments for Sale in North Charleston, SC?
| Month | Median Price |
|---|---|
| Jun 2024 |
$230,393
|
| May 2024 |
$230,707
|
| Apr 2024 |
$244,186
|
| Mar 2024 |
$244,186
|
| Feb 2024 |
$244,186
|
| Jan 2024 |
$244,186
|
| Month | Median Price |
|---|---|
| Jun 2024 |
$434,784
|
| May 2024 |
$422,743
|
| Apr 2024 |
$397,011
|
| Mar 2024 |
$661,750
|
| Feb 2024 |
$661,750
|
| Jan 2024 |
$661,750
|
Household Income
The average household income in North Charleston, SC grew from $39,703 to $39,944 in the past year. This data is an estimate based upon 40,577 households in North Charleston, SC . The chart below presents how household income is distributed in North Charleston, SC in comparison to the revenue allocation amid households nationally.
Property Value
According to data from last year, the average property value in North Charleston, SC shifted from $144,200 to $155,900 throughout the year. The subsequent graph indicates the share of properties in the given price range in North Charleston, SC in comparison to the median property value in the same price segment across the country. According to the data, the greatest share of North Charleston, SC properties falls in the '$150,000 to $174,999' range, which is lower than the most significant median property across the country.
Rent vs. Own
Property Taxes
One of the most important aspects for property owners is the amount of property taxes. This graph shows distribution of property taxes in North Charleston, SC compared to median property taxes around the country. The prevalent amount of property taxes in North Charleston, SC equals $800, which is less than the national average.